Member Services Desk
Weekly Market Update
Economist Views
Click to expand the below image.
**Please note that the MSD Weekly will return on Friday, January 5, 2024; best wishes for the holidays!**
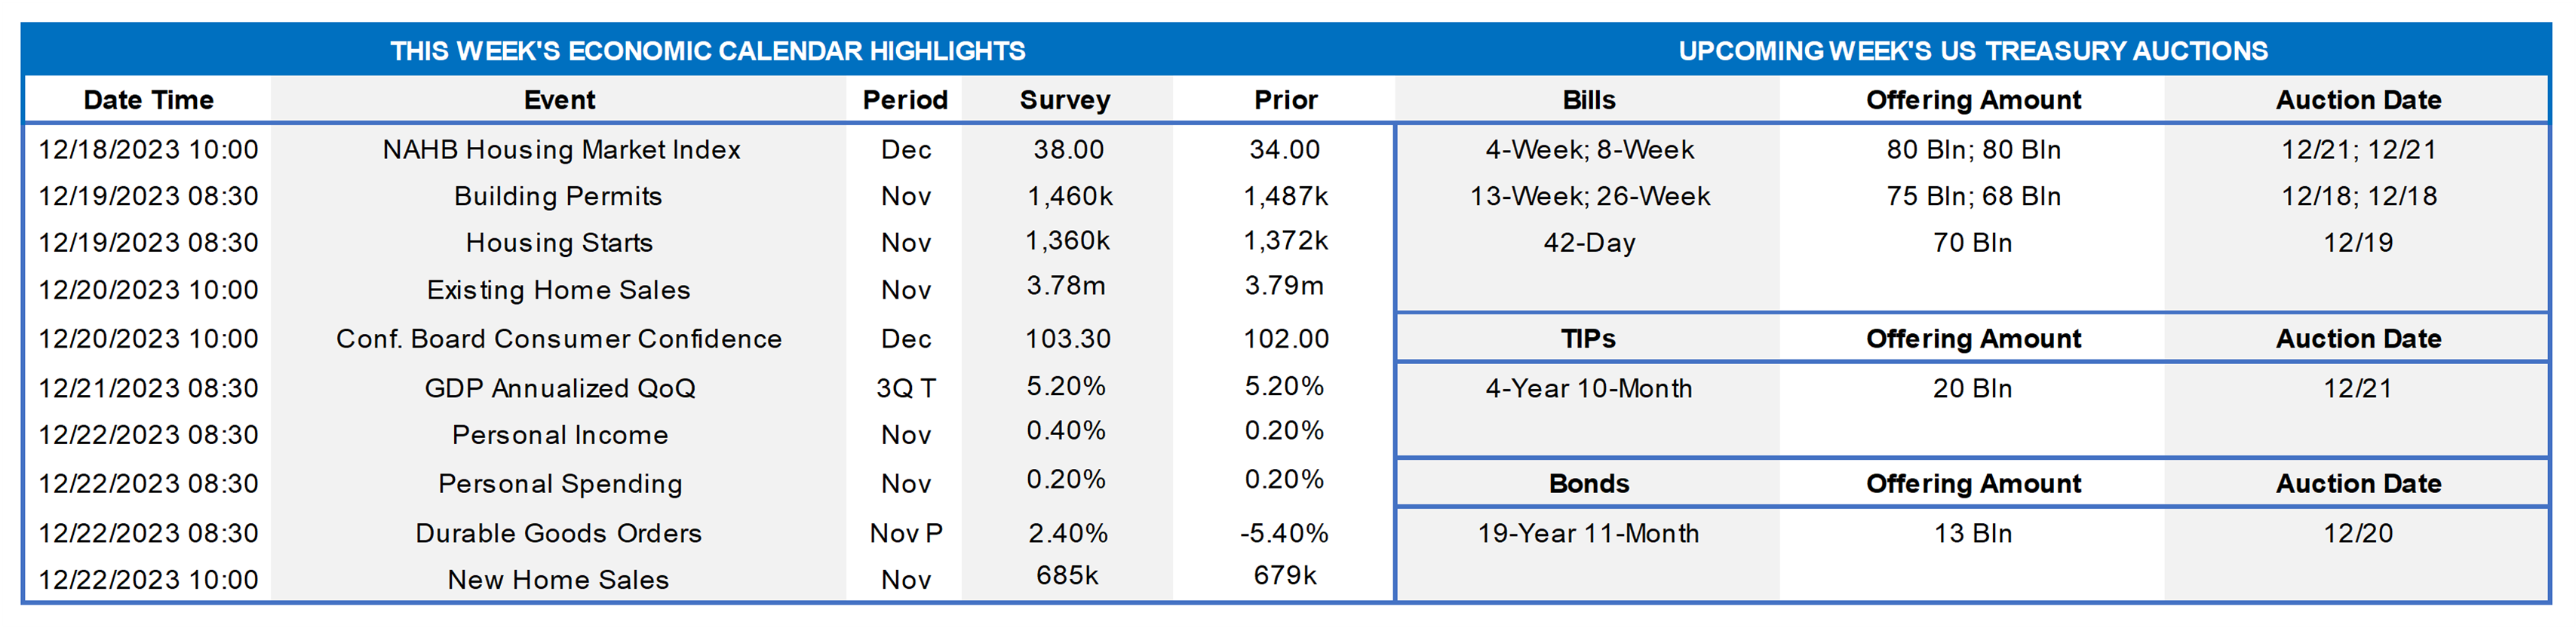
Having weathered the final Federal Open Market Committee meeting of the year and digested policymakers’ updated projections, the market’s focus will return to economic data. Soundings from the residential real estate market are expected to be mostly positive. Consumers’ appraisals of current and prospective economic conditions probably improved markedly as the traditional holiday shopping season progressed. Durable goods orders are expected to have rebounded in November, reversing a portion of the jetliner-led falloff witnessed in October. The Fedspeak circuit will be noticeably quiet, with one non-FOMC-voting district bank president slated to give his views on the outlook.
NAHB Housing Market Index: Markedly lower rates probably propelled the sentiment gauge to a three-month high of 42 in December from the 11-month low of 34 posted in November.
Housing Starts & Building Permits: Unusually favorable weather conditions, combined with more favorable terms for borrowers, likely boosted starts and new permits from their respective 1.498mn and 1.372mn annual rates recorded in October.
Existing Homes Sales: A modest reduction in home-purchase contract signings over the September-October span suggests that closings on existing dwellings dipped by 0.2% to a seasonally adjusted annual rate of 3.78mn in November – the lowest since the 3.68mn homes sold in August 2010. With the number of available homes on the market likely to contract by 8.2% to a seven-month low of 1.06mn on a not seasonally adjusted basis during the reference period, the supply at the estimated sales pace would edge two ticks lower to 3.4 months.
Conference Board Consumer Confidence: Available soundings suggest that the gauge rose sharply to a two-year high of 115 from the 102 posted in November. Pay attention to the so-called labor differential – the percentage of respondents noting that jobs are plentiful less those feeling positions are hard to get – for clues to the likely direction of the unemployment rate for this month.
Real GDP Growth: The Bureau of Economic Analysis’ final estimate of growth during the third quarter is expected to be unchanged from the 5.2% annualized pace recorded in the preliminary report.
Index of Leading Economic Indicators: Continuing a string of uninterrupted declines going back to April 2022, the Conference Board’s augur of prospective economic activity is expected to have fallen by .4% in November, after the .8% decline witnessed in October. Despite its ongoing weakness, FRB St. Louis placed the probability that the economy was contracting at the end of Q3 at just 2.2%.
Durable Goods Orders: Durable goods orders are expected to have rebounded by 2.2% in November, following the commercial jetliner-led 5.4% drop recorded in the prior month. As always, pay particular attention to core nondefense capital goods shipments excluding commercial aircraft deliveries for clues to the strength of business equipment spending as the fall quarter progressed.
Personal Income & Spending: Personal income growth likely quickened in November, climbing by .4% after a .2% gain in October. Nominal consumer spending growth, however, likely continued apace, rising by .2% and implying a slight uptick in the personal saving rate from the 3.8% posted in the prior month.
New Home Sales: Buoyed by the recent rates decline, contracts to purchase a newly constructed home likely moved back above a SAAR of 700K in November, following the 679K recorded in October.
Federal Reserve Appearances: Dec. 19 — Atlanta Fed President Bostic to speak on the U.S. economic outlook at the local Harvard Business School Club.
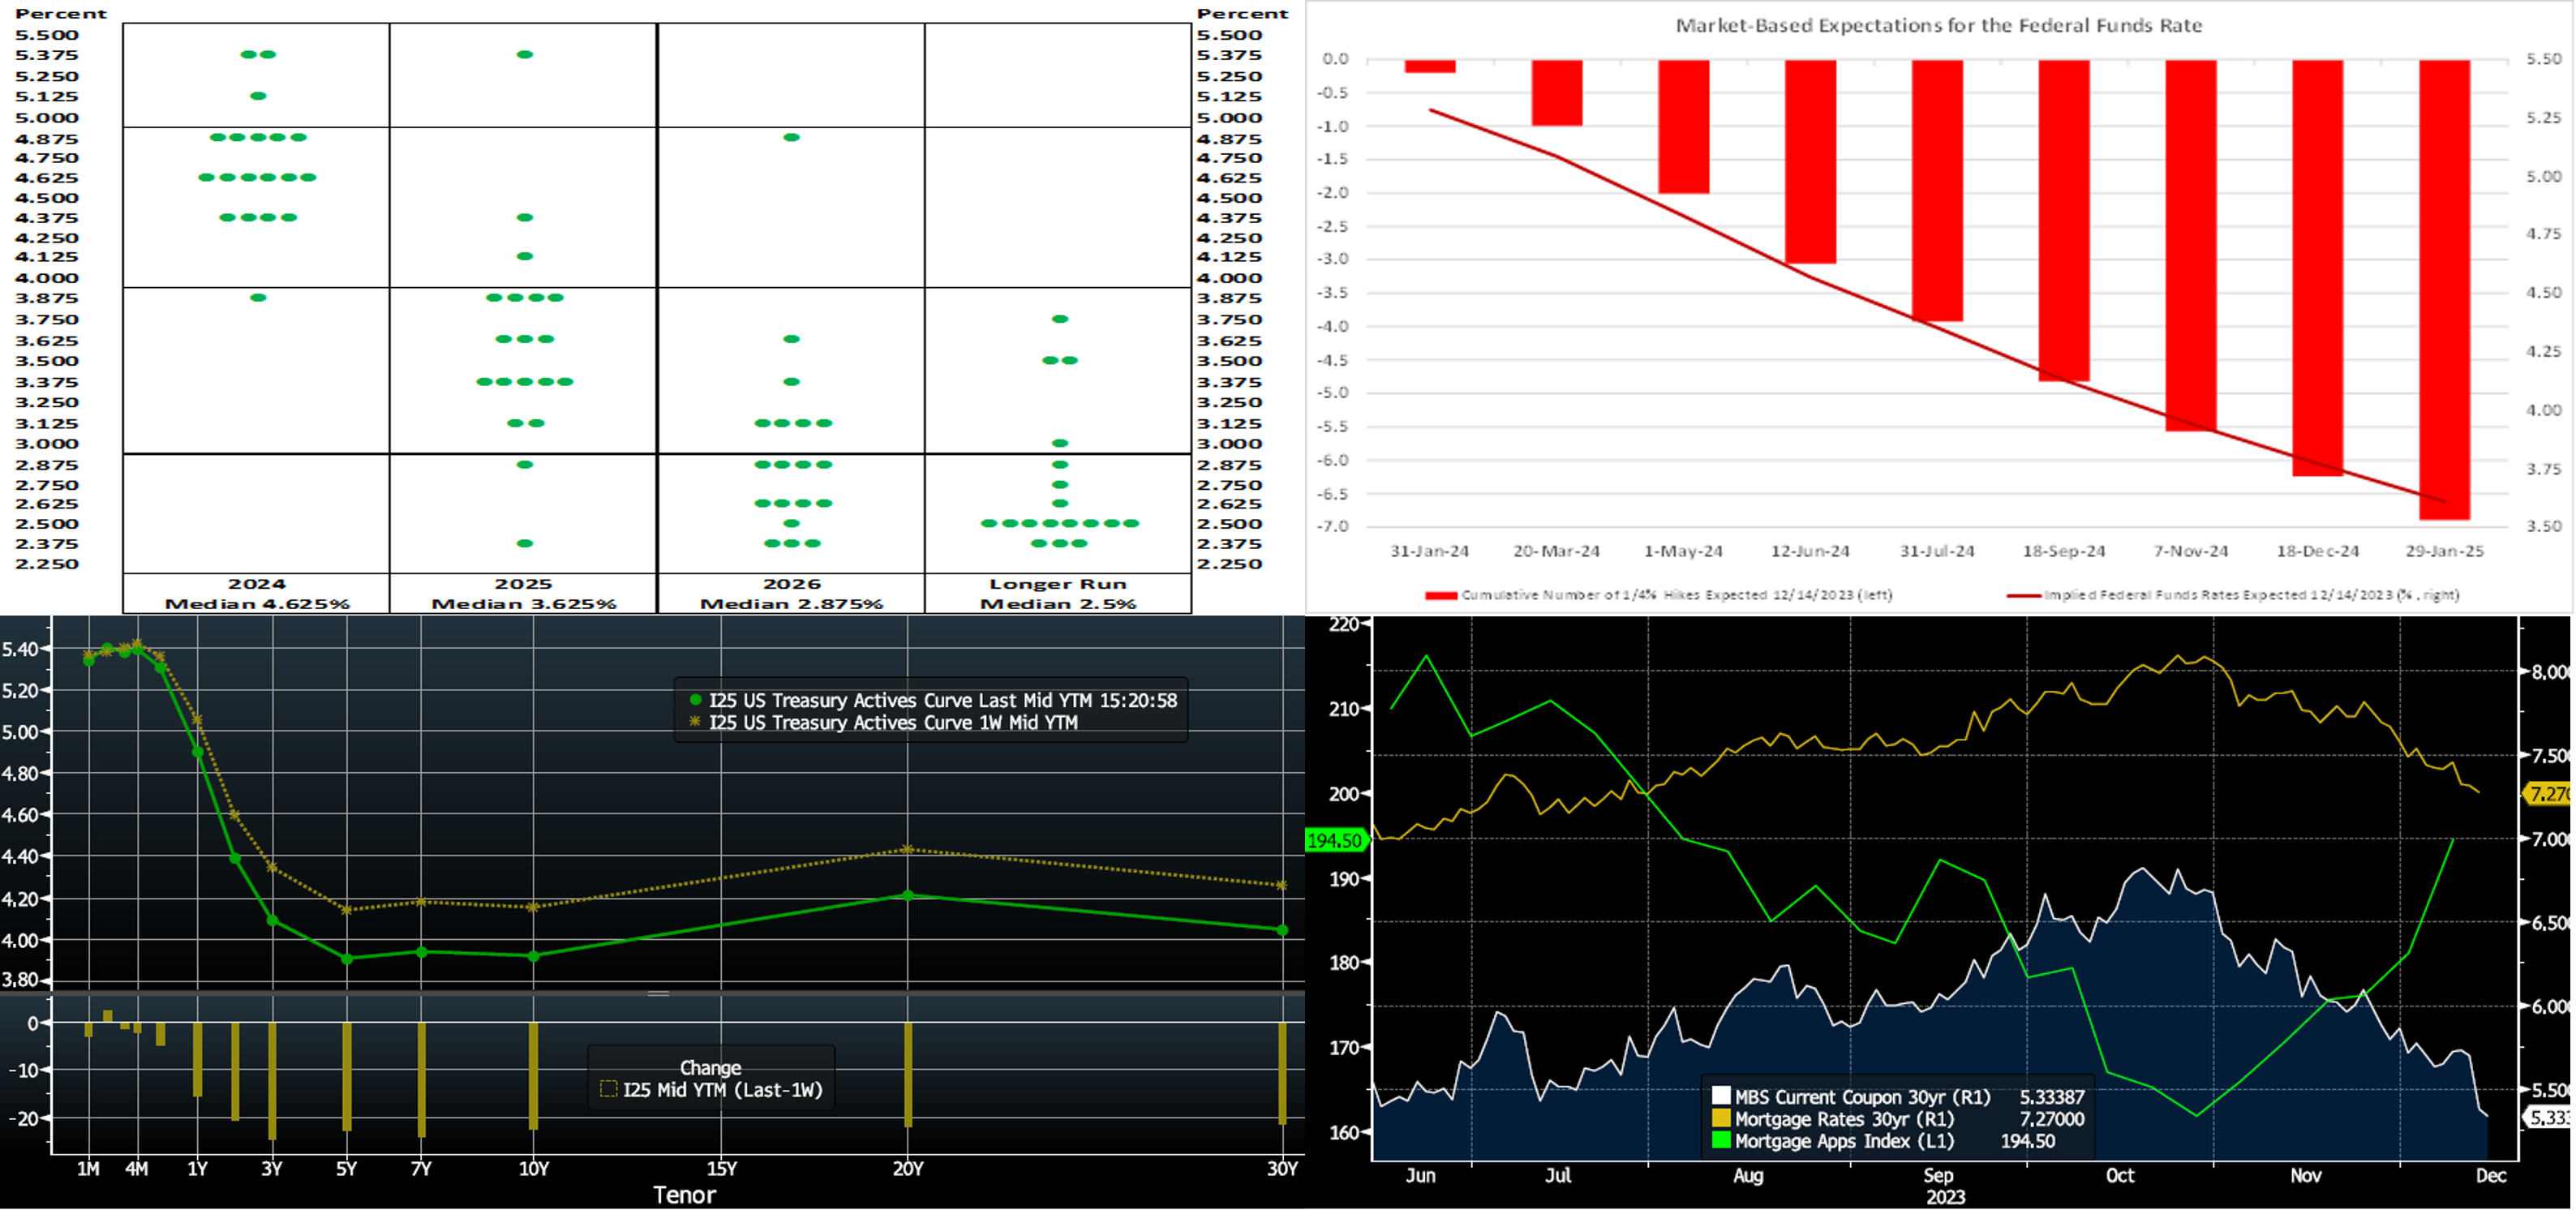
CHART 1 UPPER LEFT and CHART 2 UPPER RIGHT
Source: Bloomberg; Board of Governors of the Federal Reserve System; FHLB-NY. As per the convention, the Federal Reserve Board also released an updated Summary of Economic Projections, or SEP. The so-called “dot plot”, seen here, contained significant changes to policymakers’ expectations for the federal funds rate target over the next two years. Fed officials now anticipate that the equivalent of three 25-bps cuts in administered rates are likely over the course of 2024, thereby leaving the target range at 4½% to 4¾% by yearend 2024. The median call for yearend 2025 now entertains the possibility of further rate cuts to 3½% to 3¾%. The median forecast for year-end 2026 stands at 2¾% to 3%. Market participants in aggregate, as priced into the yield curve, believe that the FOMC may begin easing monetary policy as early as March 2024 and anticipate significantly larger rate cuts, relative to the dot plot, that will leave the federal funds rate near 3¾% at end of 2024.
CHART 3 LOWER LEFT
Source: Bloomberg. Top pane is yield (LHS, %), bottom pane is change (LHS, bps). From last Thursday afternoon to this one, the UST curve moved notably lower, with 2-year-and-out yields all over 20 bps lower week-over-week. Yields had tacked higher to begin the week, but the FOMC outcome triggered a massive (20 to 30 bps, with shorter tenors declining most) drop in yields. Street dealers have been scrambling to revise their 2024 forecasts since! It’s an open question if the market response in pricing rates and risk assets has now gotten “over its skis”; in some ways, 2024 forecasts came to fruition all in a few weeks. And so now the economic data will be monitored closely again in the week ahead. In terms of market-implied pricing of the Fed, the chance of a 25p cut in March is ~87%. Meanwhile, as covered above, much deeper cuts have been priced into the curve for mid-2024, with cumulatively now ~45 bps of cuts in May. The year-end 2024 forward is ~25 bps lower from a week ago, now ~3.80% — that equates to over 6 rate cuts in the year!
CHART 4 LOWER RIGHT
Source: Bloomberg. Being the last edition of this year, let us end on a hopeful note. The past week’s FOMC provided further impetus to lower yields, and this, in turn, has led to significantly lower mortgage-related rates. Shown here are the MBS 30-year Current Coupon (White, RHS, %), the BankRate.com 30-year Mortgage Rate National Average (Gold, RHS, %), and the Mortgage Bankers Association’s Mortgage Applications (purchase and refinancings) Index (Green, LHS). The downward move in MBS yield has been massive and was assisted by a notable tightening in MBS spreads; indeed, the Current Coupon is ~150bps lower now compared to late October! In turn, mortgage rates have also declined albeit only ~85 bps in this timeframe. But mortgage rates often lag swift market moves and may begin to “catch up” in the coming weeks. Already, as seen here, the decline in rates has sparked an uptrend in mortgage applications. These dynamics should, at the least, provide some relief and/or a better prognosis for both prospective homebuyers and mortgage providers.
FHLBNY Advance Rates Observations
Front-End Rates
- Short-end rates were mostly lower week-over-week. While shorter tenors were only modestly lower, the 6-month was 6 bps lower, as it crosses into the timeline of the Fed cuts being priced into the curve. Net T-bill supply remains positive, given announcements from Treasury regarding upsized auctions and issuance needs. But the supply continues to be absorbed relatively well, as Money Market Funds (MMFs) switch from the Fed’s RRP to T-bills with competitive yields. Moreover, MMFs currently stand at or near all-time high AUM levels.
- The market will focus on economic data this upcoming week.
Term Rates
- The longer-term curve, generally mirroring the moves in USTs and swaps, moved significantly lower week-on-week. The 2-year-and-out sector was down on average by ~24 bps.
- On the UST term supply front, the upcoming week serves a 20-year nominal and a 5-year TIPS auction. Note that UST auctions usually occur at 1pm and can occasionally cause volatility around that time. Please contact the Member Services Desk for further information on market dynamics, rate levels, or products.
Grant funding under the FHLBNY 2023 Small Business Recovery Grant (SBRG) Program has begun and some funds are still available. The SBRG Program provides grant funds to benefit FHLB-NY members’ small business and non-profit customers. Please visit the SBRG webpage.
Price Incentives for Advances Executed Before Noon: In effect as of Tuesday, September 5, 2023, the FHLBNY is pleased to now offer price incentives for advances executed before Noon each business day. These pricing incentives offer an opportunity to provide economic value to our members, while improving cash and liquidity management for the FHLBNY. For further details, kindly refer to the Bulletin.
The Symmetrical Prepayment Advance Feature
For those anticipating term funding needs, and with rates on an uptrend, it can be an appropriate juncture to consider our SPA feature. This feature allows the member to capture, at prepayment, changes in the fair value of the advance which are favorable to the member. Contact Member Services Desk to discuss.
Looking for more information on the above topics? We’d love to speak with you!
Questions?
If you wish to receive the MSD Weekly Market Update in .pdf format (includes FHLBNY rate charts) or to discuss this content further, please email the MSD Team.