Member Services Desk
Weekly Market Update
This MSD Weekly Market Update reflects information for the week ending November 18, 2022.
Economist Views
Click to expand the below image.
Happy Thanksgiving!
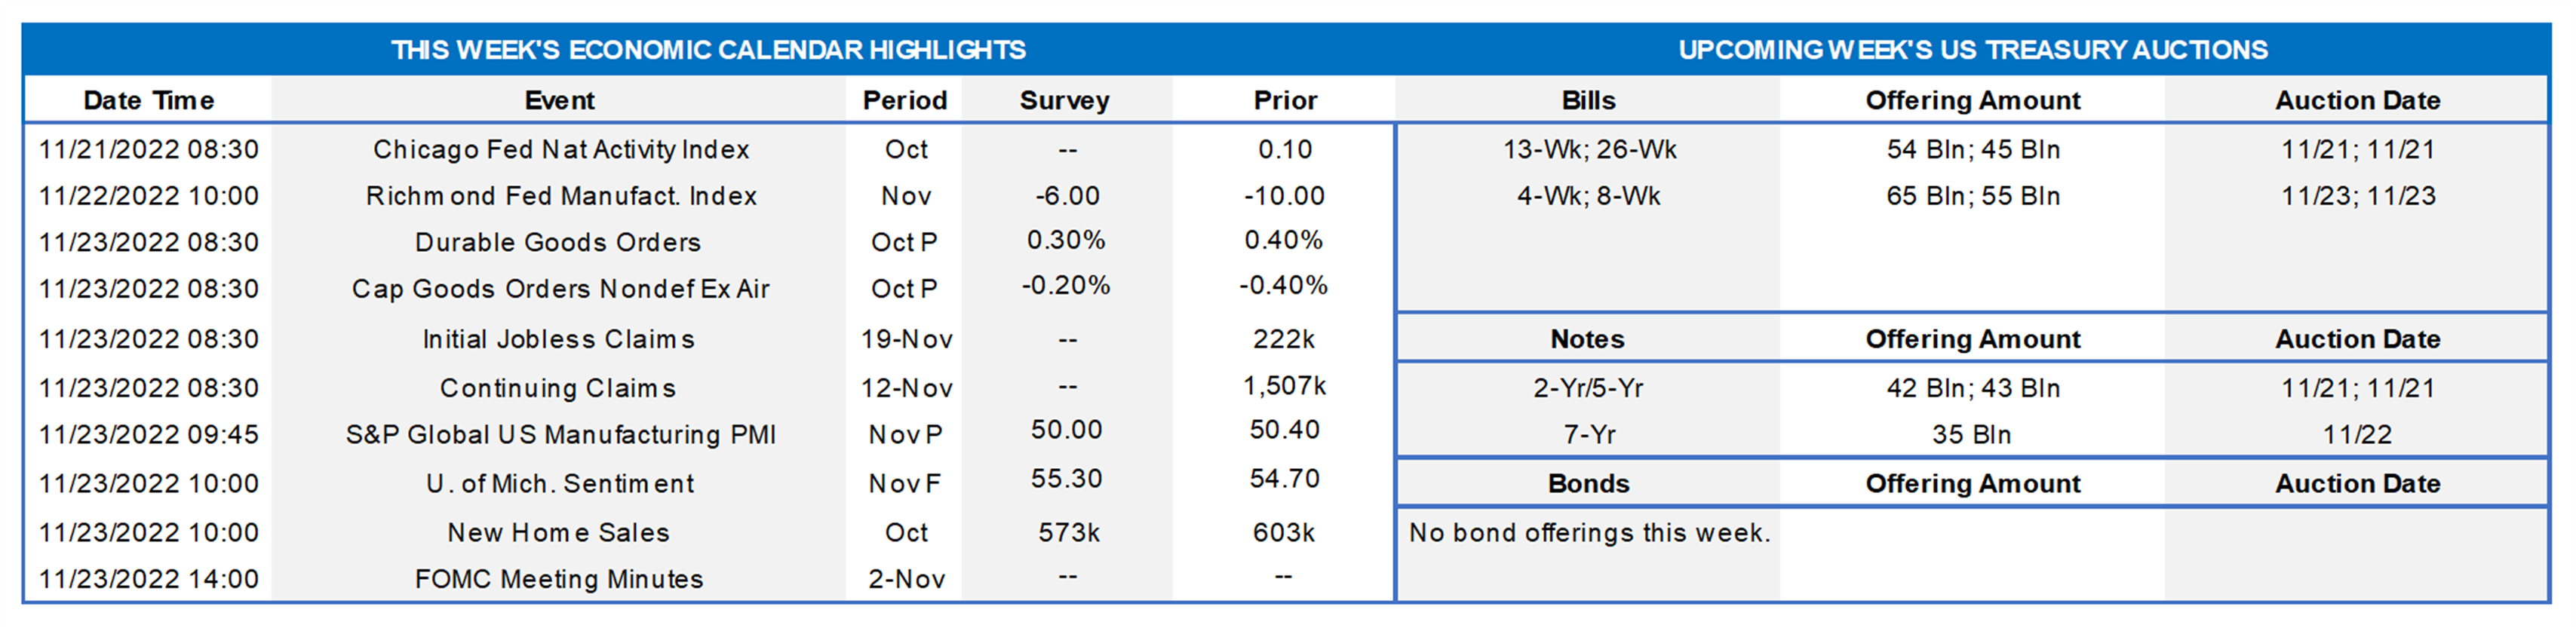
Market participants will face a light statistical calendar this week ahead of the Thanksgiving holiday. Durable goods bookings likely posted another modest rise in October, while contracts to buy a newly constructed dwelling tumbled to a three-month low. Jobless claims probably remained in recent ranges. Consumer sentiment is expected to show a modest improvement during the latter half of November. A trio of Federal Reserve District Bank Presidents – all FOMC voters – will provide their thoughts on a variety of issues. The minutes of the November 1-2 FOMC meeting should provide some useful color on participants’ views of the lags involved in conducting monetary policy and may shed some light on the possibility for smaller rate hikes going forward.
Durable Goods Orders: Fueled by yet another aircraft-led rise in transportation equipment bookings, durable goods orders probably edged .3% higher in October, after a similarly modest .4% gain in September. Excluding the anticipated increase in transport requisitions, “hard goods” bookings likely dipped by .1%, following a .5% prior-month pullback. Pay particular attention to core nondefense capital goods shipments for clues to business equipment spending in the current quarter.
Jobless Claims: New claims for unemployment insurance benefits probably remained in the recent 210-230K range during the week ended November 19. Pay particular attention to continuing claims, which climbed above the 1.5mn mark last week for the first time since late March, for signs that recently furloughed employees are having a more difficult time finding work.
University of Michigan Consumer Sentiment Index: Consumer confidence likely improved heading into the Thanksgiving Day holiday, lifting the University of Michigan’s final November sentiment reading to 55.5 from the 54.7 posted in the preliminary report.
New Home Sales: Reported pullbacks in the numbers of single-family dwellings started and building permits issued suggest that new home sales tumbled by 8% to a seasonally adjusted annual rate of 550K in October, following a 10.9% dive in September.
Federal Reserve Appearances:
- Nov. 22 Cleveland Fed President Mester to give opening remarks at a virtual discussion about wages and inflation.
- Nov. 22 Kansas City Fed President George to take part in a policy panel hosted by the Central Bank of Chile.
- Nov. 22 St. Louis Fed President Bullard to discuss the implications of heterogeneity in macroeconomics for monetary policy.
- Nov. 23 Federal Reserve to release minutes from Nov. 1-2 FOMC meeting
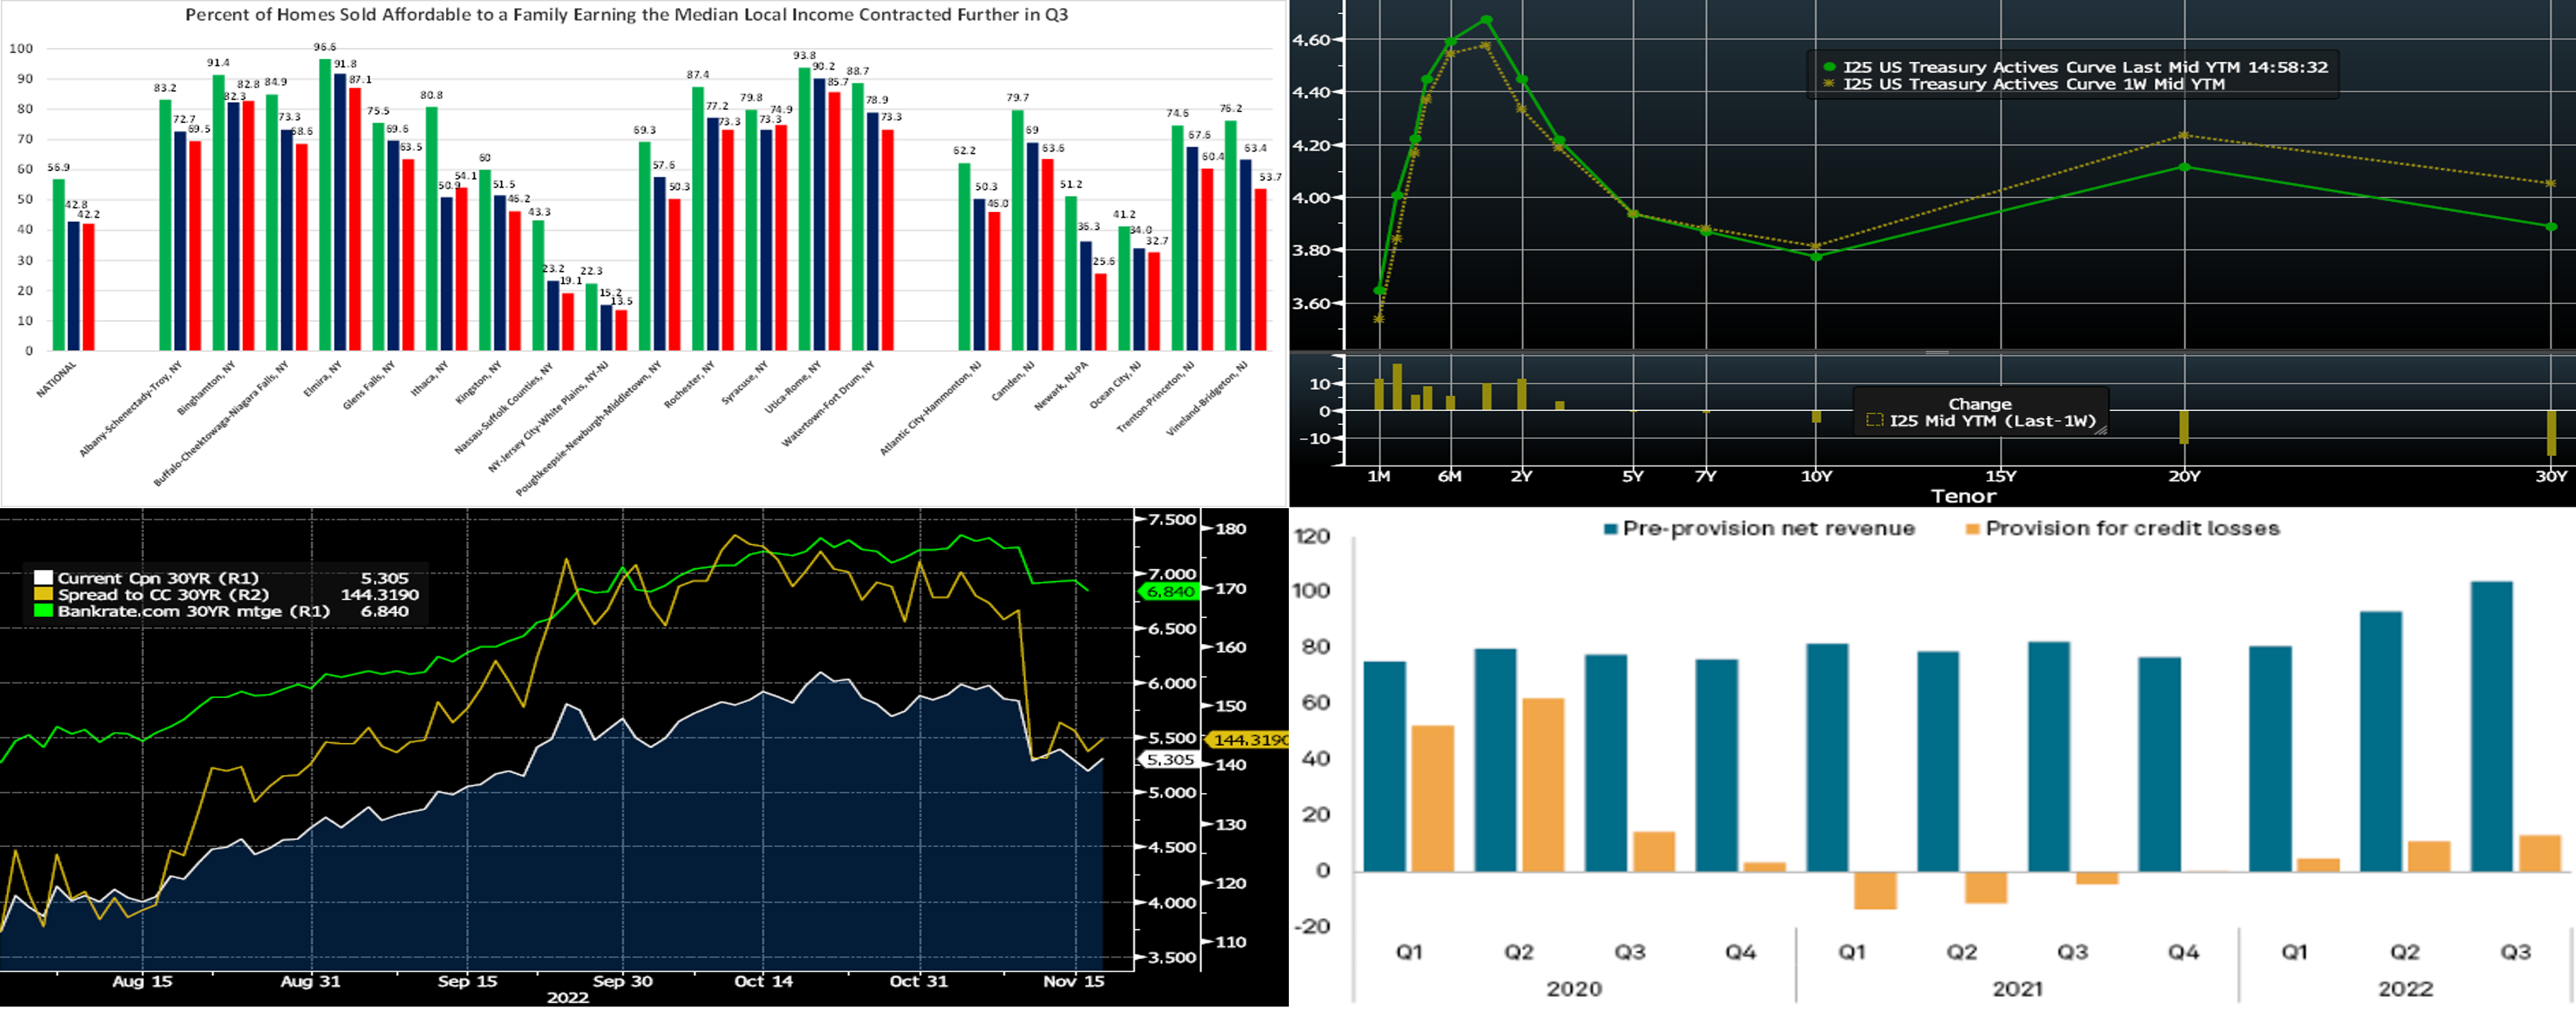
CHART 1 UPPER LEFT
Source: NAHB/Wells Fargo; FHLB-NY. The NAHB/WF Housing Opportunity Index (HOI) is defined as the share of homes sold that would have been affordable to a family earning the local median income, based on standard mortgage underwriting criteria. Therefore, there are two major components — income and housing cost. Nationwide, as seen here, just 42.2% of new and existing homes sold during Q3 (green is Q1, blue Q2, red Q3) were affordable to families earning the U.S. median income of $90K. This marks the second consecutive quarterly record low for affordability since the Great Recession, trailing the previous mark of 42.8% set in Q2. With the exceptions of Binghamton, Ithaca and Syracuse, NY, opportunity deteriorated across most of the FHLB-NY district in Q3. Opportunity in our area, over summer, ranged from a high of 87.1% in Elmira, NY to a low of just 13.5% across the NY-Jersey City-White Plains, NY-NJ metro-area. In order to assist with housing affordability challenges, we encourage members to use our housing and community lending programs; please contact the desk and/or visit https://www.fhlbny.com/community.
CHART 2 UPPER RIGHT
Source: Bloomberg. Note: Top pane is yield (%), bottom pane is change (bps). UST yields, as of late Thursday, finished mixed week-on-week, with 2-year-and-in higher but the middle of the curve relatively unchanged and longer end lower. The market now prices for a 100% chance of a 50 bps hike at the December 14th FOMC and with ~4%, up from last week’s 0%, probability of a 75 bps hike. The peak funds rate in spring 2023 last stands at ~5%, up from last week’s 4.88%. These Fed pricing changes essentially drove the move higher in the shorter portion of the curve. Although a few Fed members have expressed the possibility of smaller 50 bps hikes going forward, various officials this week also explicitly stated that their work was far from complete; indeed, the Fed’s Bullard opined on Thursday that he would like to see and/or expects a fed funds rate at least in the 5-5.25% area, if not higher.
CHART 3 LOWER LEFT
Source: Bloomberg, The recent lower-than-expected CPI and PPI data spurred a resurrection of demand from mortgage investors, perhaps as investors believe the end of the Fed tightening cycle could be in clearer sight. Shown here are the 30-year Current Coupon (imputed yield of a par-priced agency MBS), the spread of the Current Coupon to the average of the 5 and 10-year UST, and Bankrate.com’s 30-year mortgage rate index. The November 10th post-CPI decline of ~70 bps in the Current Coupon was the largest daily move in its history. Homebuyers and sellers will certainly be thankful for this pre-Thanksgiving development, given mortgage rates followed and are now sub-7% again; however, with market rates having backed up slightly in the past few sessions and Fed members declaring that their work is far from done, the longevity of this move could be vulnerable.
CHART 4 LOWER RIGHT
Source: S&P Global Intelligence. Despite looming economic uncertainties, banks have fared well this year. Indeed, net revenue across the U.S. banking industry reached another all-time high in Q3, owing to expanded net interest margins which more than offset shrinking balance sheets, weaker fee income, and higher expenses, according to S&P research data. Pre-provision net revenue (net interest income plus noninterest income minus noninterest expense) increased to $103.86bn in Q3, up 11.5% from the previous record set in Q2, led by higher net interest income. While net income was 9.5% higher sequentially, the industry’s increased level (~$13bn) of provisioning prevented a record-breaking quarter for that metric. Industry net interest margin on a fully taxable equivalent basis was 3.01%, up from 2.74% in Q2, and it was the highest level since Q1 2020. Essentially, the industry in aggregate was able to take advantage of rising rates via charging higher loan rates while mitigating the rise in funding costs. The aggregate yield on loans and leases rose 56 bps, outpacing the 32 bps rise in deposit costs.
FHLBNY Advance Rates Observations
Front-End Rates
- Short-end rates finished relatively flat in very short tenors but 5 to 10 bps higher 1-month-and-out, spurred by changes in the market’s pricing of Fed hikes and maturities now crossing further into the Fed hiking timeline; please see the prior slide for more details. Economic data and Fed-speak will provide further direction to rates this week.
- Given the Fed’s tightening and data-dependent posture, rates will remain highly responsive to the Fed and economic data. Post the past two weeks’ softer CPI and PPI data, perhaps the Michigan sentiment and inflation expectations will shed further light on this front.
Term Rates
- The longer-term curve finished mixed week-on-week, roughly mirroring moves in the UST and swaps markets. Levels were ~13-14 bps higher in the 1 to 2-year, ~3-5 bps lower in the 4 to 8-year, and ~ 11 bps lower in the 10-year. Kindly refer to the previous section for relevant market color. The advance curve remains inverted out to 5-year, thereby offering opportunities to extend in advance duration for minimal or lower coupon cost. The flat curve and high implied volatility environment also can serve to make putable advances more compelling.
- On the UST term supply front, this upcoming holiday-shortened week offers 2/5/7-year auctions all squeezed into Monday-Tuesday. Market focus will remain on Fed-speak. Kindly call the Member Services Desk for information on market dynamics, rate levels, or products.
Product Alert: FHLBNY is pleased to announce the reintroduction, after a temporary suspension owing to Libor-cessation, of the Putable Advance, Fixed-Rate with SOFR Cap Advance, and ARC with SOFR Cap/Floor Advance. The Callable Advance continues to be offered. This expansion of the product menu will provide members with more options and flexibility for the management of funding and/or hedging needs.
Forward Start Advance (FSA): For members with upcoming borrowing or refunding plans, consider the FSA as a method to opportunistically “lock in” rates before advance settlement date.
Please call the Member Services Desk at (212) 441-6600 for more information.
The Symmetrical Prepayment Advance Feature
For those anticipating term funding needs, and with rates on an uptrend, it can be an appropriate juncture to consider our SPA feature. This feature allows the member to capture, at prepayment, changes in the fair value of the advance which are favorable to the member. Contact Member Service Desk to discuss.
Looking for more information on the above topics? We’d love to speak with you!
Questions?
If you wish to receive the MSD Weekly Market Update in .pdf format (includes FHLBNY rate charts) or to discuss this content further, please email the MSD Team.