Member Services Desk
Weekly Market Update
This MSD Weekly Market Update reflects information for the week ending January 5, 2024.
Economist Views
Click to expand the below image.
Happy New Year! Please note that the monthly employment situation report, to be released on Friday, 1/5, at 8:30 a.m., may impact markets and any rate levels referred to herein.
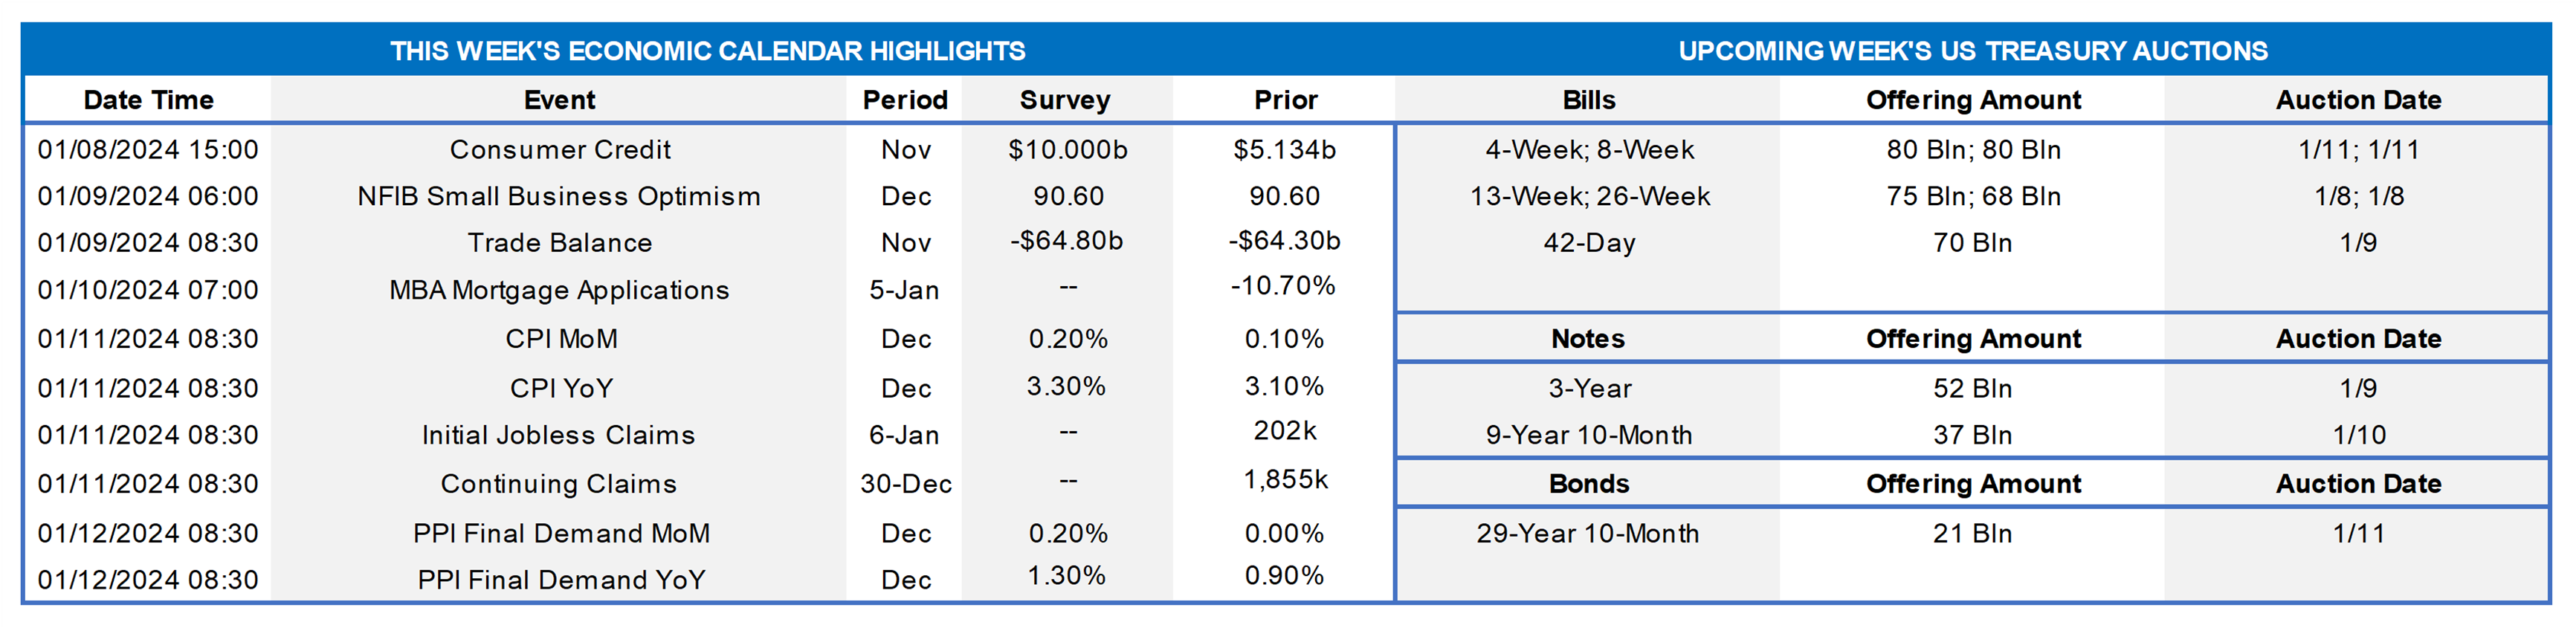
Having digested the Bureau of Labor Statistics’ update on the employment situation in December, the focus of market participants will turn to the inflation side of the Federal Reserve’s dual mandate this week. Headline and core consumer price gauges are expected to have posted modest increases in the final month of the year, with year-to-year growth rates remaining well above the Fed’s desired target. Shelter costs – the primary driver of consumer price inflation in 2023 — will be watched closely for any signs of improvement in the upcoming report. Aside from the Consumer Price Index (CPI) report, the statistical release calendar will be quiet. The Census Bureau’s update on merchandise trade in November will allow economists to tweak their tracking estimates for Q4 real GDP growth. A trio of Federal Reserve Bank presidents, two of whom are FOMC voters this year, are slated to give their views on the economic outlook.
Consumer Credit: Consumer installment credit is expected to have expanded by $10bn in November, following a comparatively modest $5.1bn takedown in October.
NFIB Small Business Optimism Index: The barometer probably was little changed in December from the average 90.7 reading posted over the prior three months.
Merchandise Trade Balance: The deficit on international trade in goods likely widened to $64.8bn in November from the $64.3bn shortfall posted in the previous month.
Consumer Prices: Sans the benefit of weaker retail energy costs witnessed in November, the CPI probably edged 0.2% higher in December, following a 0.1% uptick in the prior month. The core CPI, excluding volatile food and energy components, is expected to have climbed by 0.2% as well during the reference period, after a 0.3% gain in November. If those projections are on the mark, the overall and core CPIs rose by 3.2% and 3.8%, respectively, during calendar 2023 – both well above the Federal Reserve’s desired 2% target.
Jobless Claims: Initial claims for unemployment insurance benefits likely climbed during the week ended January 6 from the 202K prior-period tally but remained in the recent 205-220K range. Keep an eye on continuing claims for the week ended December 30 for any signs that recently furloughed workers are facing a tougher time finding jobs.
Producer Prices: An anticipated modest quickening in core wholesale goods costs probably pushed the Producer Price Index (PPI) for final demand 0.2% higher in December – the first increase since the 0.4% rise posted in September. That projection, if realized, would leave the headline PPI just 1.4% above its year-ago level – a dramatic reduction from the peak 11.6% jump witnessed over the 12 months ended March 2022.
Federal Reserve Appearances:
- Jan. 8 Atlanta Fed President Bostic to speak to the Atlanta Rotary Club about the 2024 economic outlook.
- Jan. 10 New York Fed President Williams to give a speech on the 2024 economic outlook at an event in White Plains, NY.
- Jan. 12 Minneapolis Fed President Kashkari to participate at bank’s annual Regional Economic Conditions Conference.
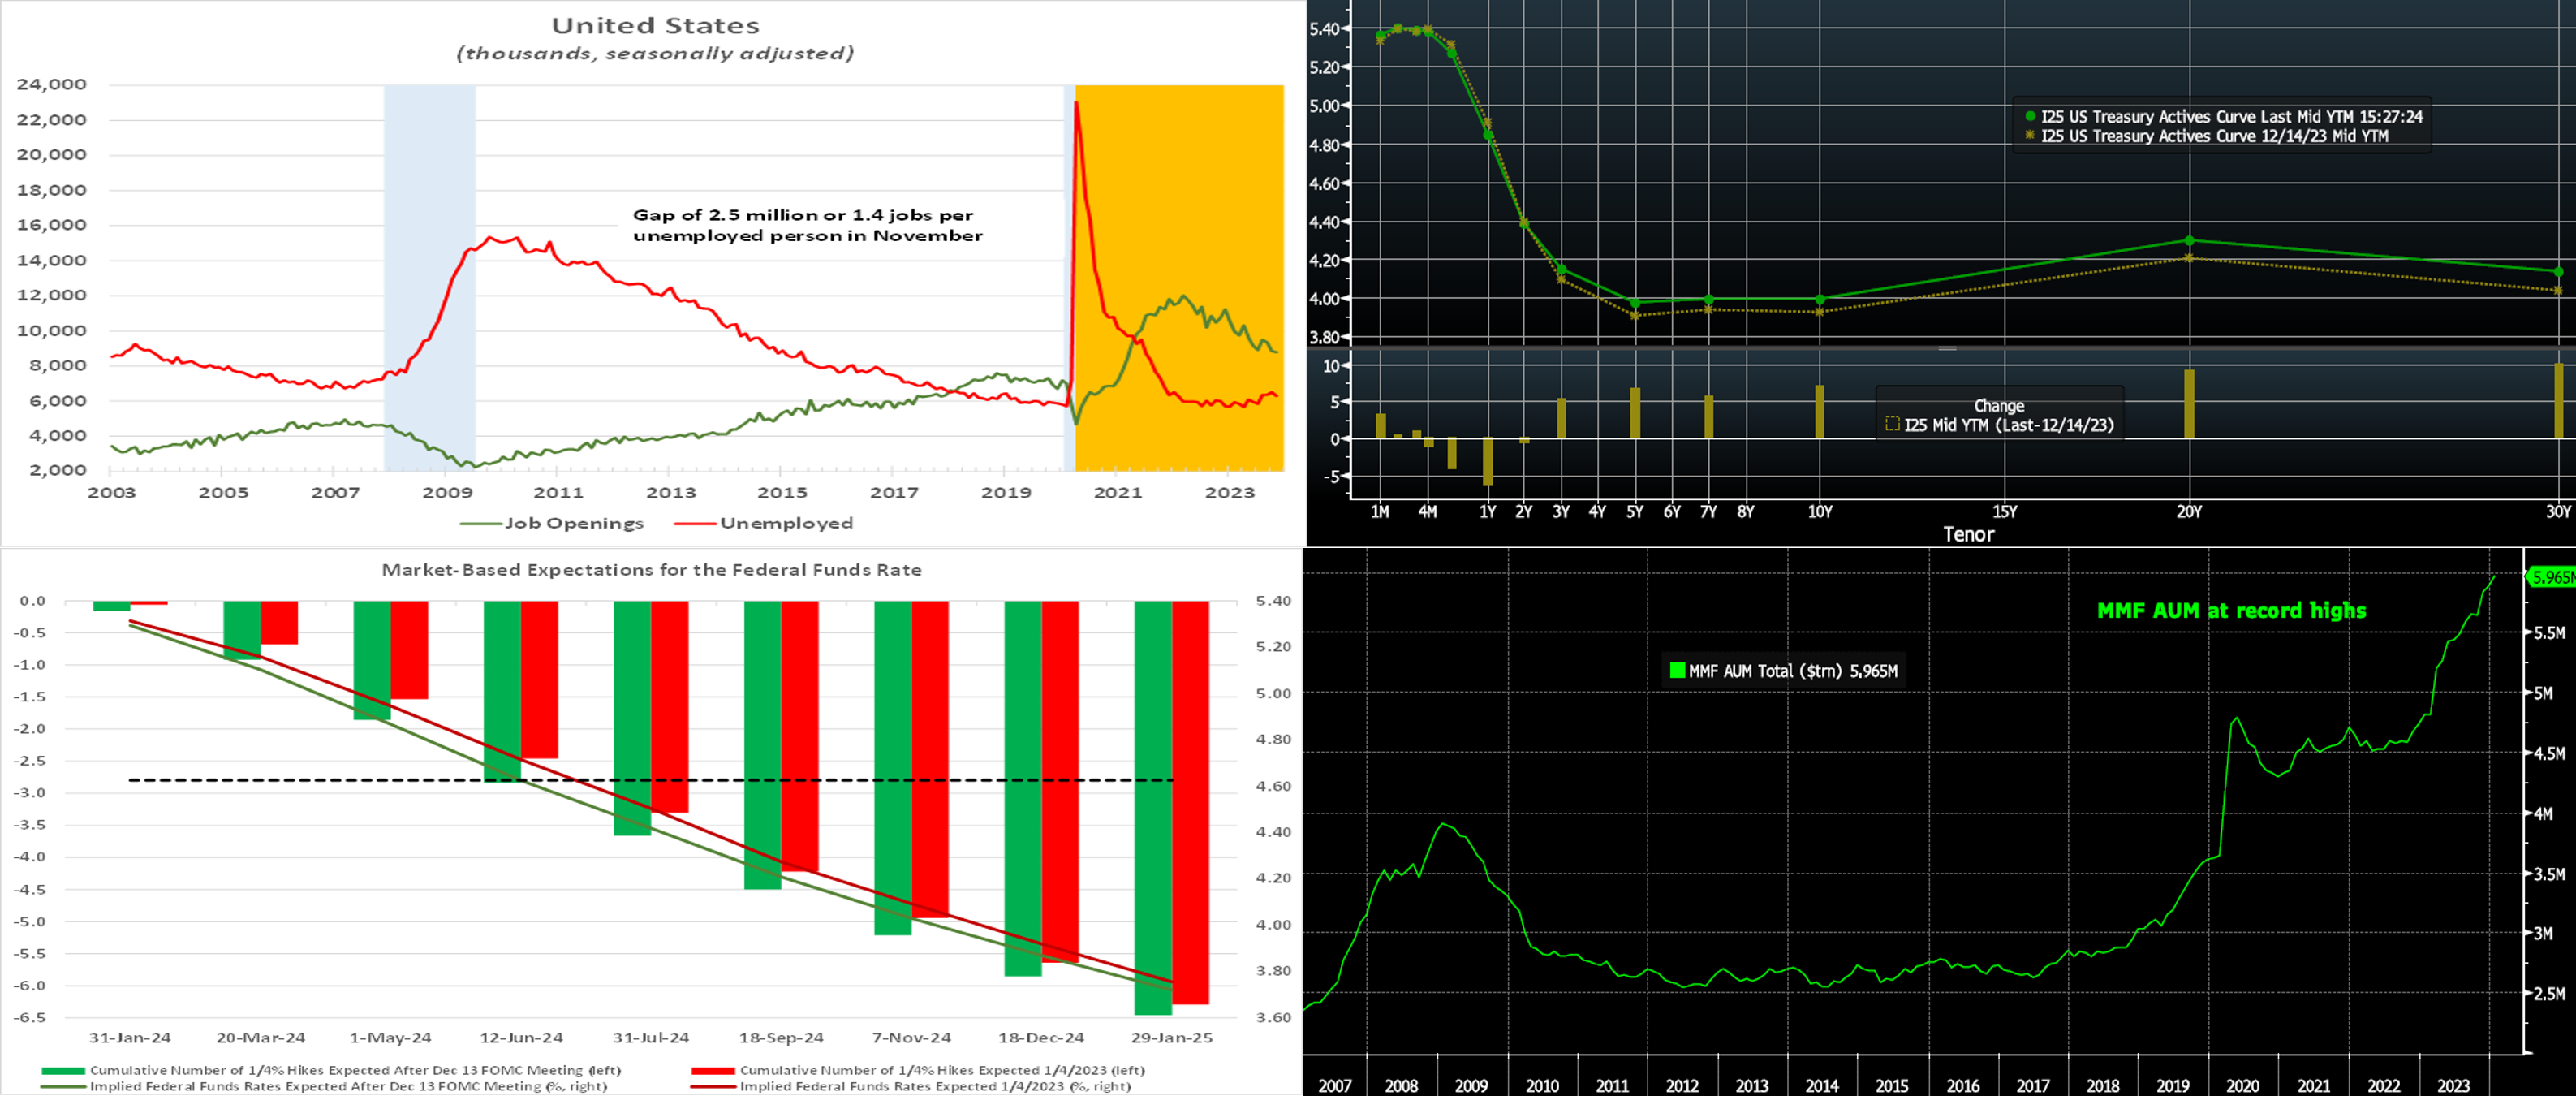
CHART 1 UPPER LEFT
Source: Bureau of Labor Statistics; National Bureau of Economic Research; FHLB-NY. Notes: Blue-shaded areas denote recessions; orange-shaded area highlights current economic expansion. Job openings remained on a downtrend in November. After reaching a peak of a little over 12mn in March 2022, available positions have since retreated to 8.8mn last November. While the decline over the past 20 months has been taken as a sign that labor-market conditions are easing, job openings still eclipsed those unemployed by 2.5mn in the latest reporting period. Put another way, there were 1.4 jobs per unemployed person in November, double the 0.7 average since the BLS started tracking job-opening data in December 2000.
CHART 2 UPPER RIGHT
Source: Bloomberg; FHLB-NY. Top pane is yield (LHS, %), bottom pane is change (LHS, bps). From three Thursdays ago to this one, the UST curve bear steepened in modest fashion, with 3-year-and-out tenors up by ~5 to 10 bps. Much of the move occurred in the past week, as the market slightly lowered their rate cut pricing and as economic data continued to show resilience. Further adding upward pressure on yields was turn-of-the-year profit-taking and re-positioning among investors as well as the usual resurgence of corporate bond issuance. And so now the economic data will be monitored closely again in the week ahead. In terms of market-implied pricing of the Fed, the chance of a 25p cut in March is ~65%, down from 87% three weeks ago. Read below for further information on market pricing of the Fed.
CHART 3 LOWER LEFT
Source: Bloomberg; FHLB-NY. As we begin a new year, we take a fresh look here at market pricing of Fed expectations. In the days following the December 13th FOMC and around our last edition, the market aggressively priced for rate cuts in the months and year ahead, as seen in Green in the chart. Indeed, there were 3 cuts of 25 bps priced by June 2024, and close to 6 for the year. This exuberance on rate cuts has been tempered somewhat in the last week, owing to healthy economic data and likely profit-taking/re-positioning at the start of the new year. The current pricing (Red) still aggressively prices cuts but to a lesser degree than a few weeks ago, as there are ~2.4 cuts of 25 bps priced by June and ~5.5 for the full year. Note that the market’s pricing for 2024 remains well below the Fed’s last year-end 2024 dot (shown in black dashed line) of 4.625%. In this regard, further declines in the market pricing would appear challenging at this juncture, at least absent some significantly weaker data.
CHART 4 LOWER RIGHT
Source: Bloomberg. Money Market Funds (MMF) total AUM finished 2023 at record levels on a long-term historical basis, as seen here. AUM continued to increase in the last few months of the year along with the rally in bond and equity prices. History has shown that AUM can continue to increase through the initial stages of a Fed easing cycle, and so the upward trend in AUM may persist and continue to pose competition to bank deposits.
FHLBNY Advance Rates Observations
Front-End Rates
- Short-end rates were mostly lower from three weeks ago. While shorter tenors were only modestly lower, the 5 and 6-month tenors were 4 and 6 bps lower, as they cross further into the timeline of the Fed cuts being priced into the curve. Net T-bill supply remains positive, given announcements from Treasury regarding upsized auctions and issuance needs. But the supply continues to be absorbed relatively well, as Money Market Funds (MMFs) currently stand at or near all-time high AUM levels.
- The market will focus on economic data, particularly CPI, this upcoming week.
Term Rates
- The longer-term curve, generally mirroring the moves in USTs and swaps, moved modestly higher from three weeks ago. While the shorter tenors were relatively unchanged, the 3-year-and-out sector was 3 to 7 bps higher. Please refer to the previous section for color.
- On the UST term supply front, the upcoming week serves challenging auctions of 3/10/30-year securities. Note that UST auctions usually occur at 1pm and can occasionally cause volatility around that time. The usual heavy January corporate bond issuance calendar should also feature in the week ahead. Please contact the Member Services Desk for further information on market dynamics, rate levels, or products.
Price Incentives for Advances Executed Before Noon: In effect as of Tuesday, September 5, 2023, the FHLBNY is pleased to now offer price incentives for advances executed before Noon each business day. These pricing incentives offer an opportunity to provide economic value to our members, while improving cash and liquidity management for the FHLBNY. For further details, kindly refer to the Bulletin.
The Symmetrical Prepayment Advance Feature
For those anticipating term funding needs, and with rates on an uptrend, it can be an appropriate juncture to consider our SPA feature. This feature allows the member to capture, at prepayment, changes in the fair value of the advance which are favorable to the member. Contact Member Services Desk to discuss.
Looking for more information on the above topics? We’d love to speak with you!
Questions?
If you wish to receive the MSD Weekly Market Update in .pdf format (includes FHLBNY rate charts) or to discuss this content further, please email the MSD Team.