Member Services Desk
Weekly Market Update
This MSD Weekly Market Update reflects information for the week of June 20, 2022.
Economist Views
Click to expand the below image.
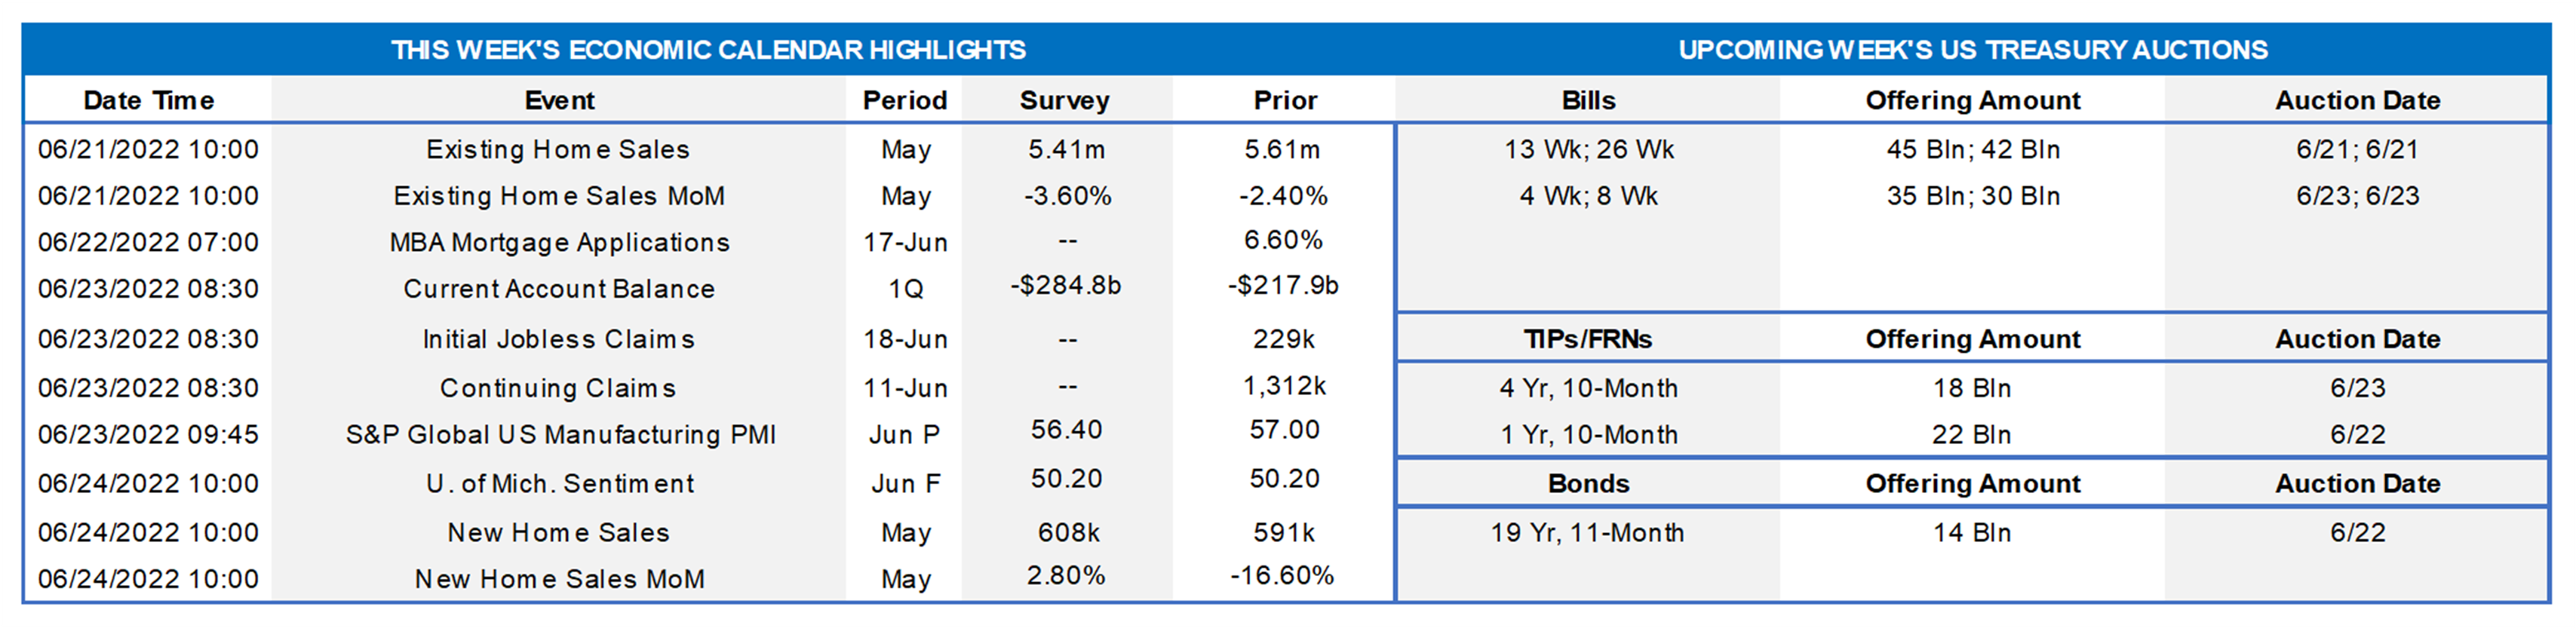
Having weathered the largest increase in official rates since 1994, market participants will face a very light economic release calendar this week. Both existing and new home purchases likely declined in May. The current account deficit probably clocked in at a record wide during the winter quarter. Weekly soundings on jobless claims are expected to be consistent with ongoing tightness in labor market conditions. The Federal Reserve speaking calendar will be extremely crowded, with Chair Jerome Powell’s appearances before Congress enjoying pride of place.
Existing Home Sales: The falloff in home-purchase contract signings recorded over the March-April span suggests that closings probably declined by 2.7% to a two-year low seasonally adjusted annual rate of 5.46mn in May. With the number of homes on the market expected to jump by an estimated 9.5% to 1.04mn during the reference period, the stock of available dwellings likely climbed three ticks higher to 2.3 months’ supply.
Current Account Balance: The massive deterioration of the merchandise trade balance witnessed over the January-March span probably left the current account deficit at a record-wide $280bn, after the $217.9bn shortfall posted in the final quarter of 2021.
Jobless Claims: Solid demand for workers probably left initial and continuing state unemployment insurance claims lower in their respective reporting periods.
Michigan Sentiment Index: Consumers’ appraisals of current and prospective economic conditions may have eroded further during the latter half of the month, pushing the University of Michigan’s confidence gauge to yet another record low.
New Home Sales: Reported declines in single-family housing starts and building permits suggest that the number of newly constructed homes entering contract tumbled by 6.9% to a seasonally adjusted annual rate of 550K – the lowest tally since December 2018.
Federal Reserve Appearances:
- June 21 Cleveland Fed President Loretta Mester to speak at a Women in Leadership event in Cleveland.
- June 21 Richmond Fed President Thomas Barkin to speak to the Richmond chapter of the Risk Management Association.
- June 22 Fed Chair Jerome Powell to deliver semi-annual monetary policy testimony before the Senate Banking Committee.
- June 22 Chicago Fed President Evans to discuss the economic outlook at an event hosted by the Corridor Business Journal.
- June 22 Philadelphia Fed President Harker and Richmond Fed President Barkin to discuss the economic outlook.
- June 23 Fed Chair Jerome Powell to deliver semi-annual testimony before the House Financial Services Committee.
- June 23 St. Louis Fed President James Bullard to discuss central banks and inflation at an event hosted by UBS in Zurich.
Click to expand the below image.
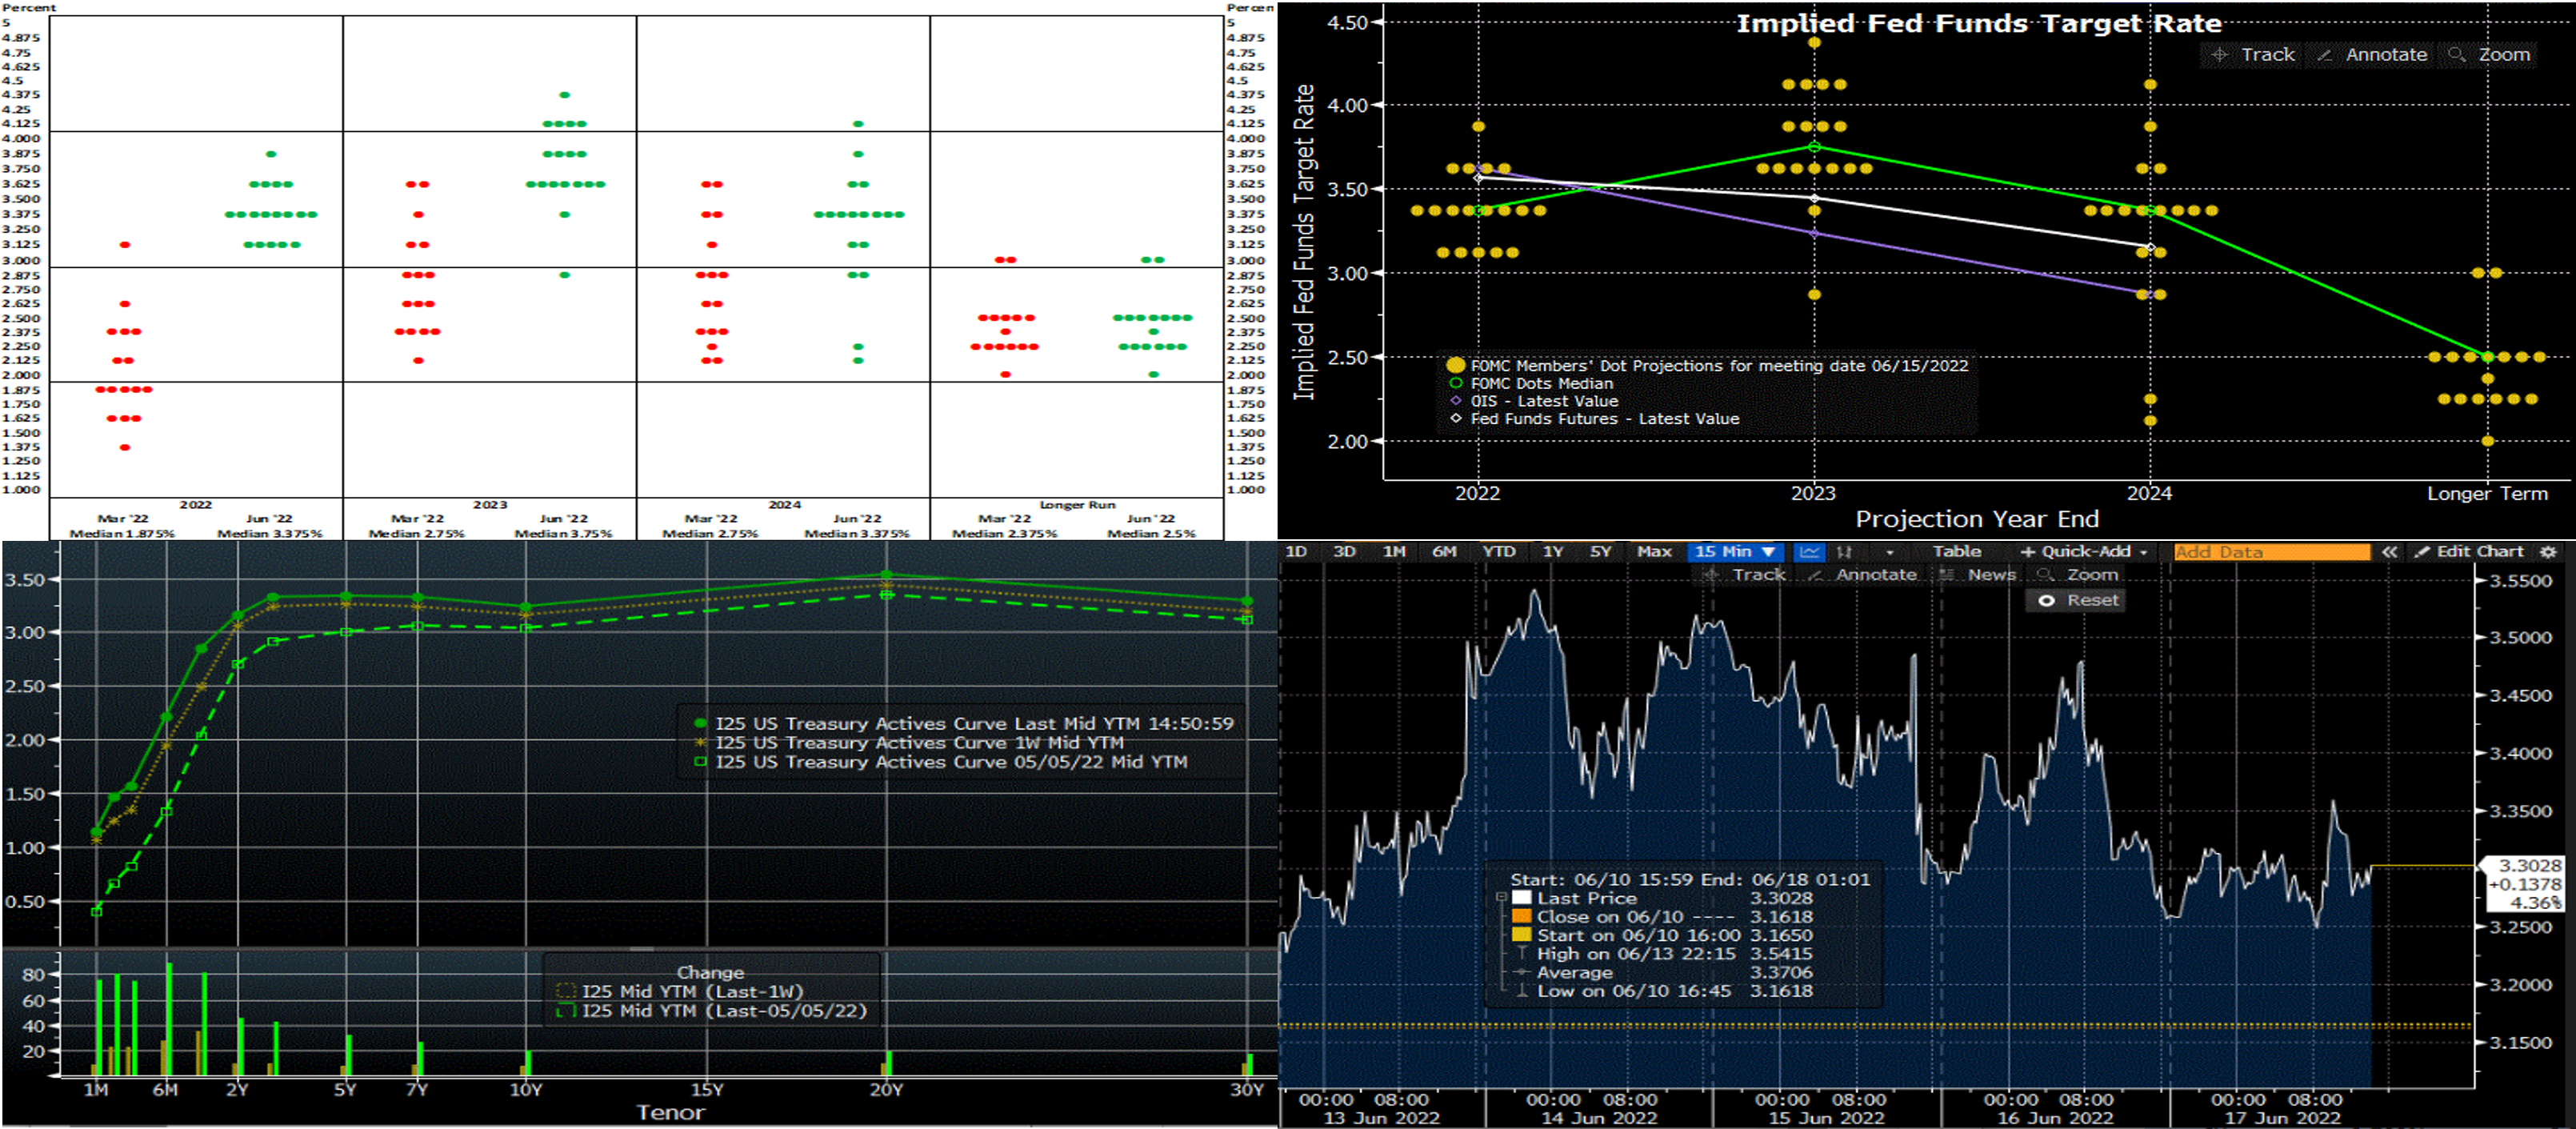
CHART 1 UPPER LEFT
Source: Board of Governors of the Federal Reserve System, Bloomberg, FHLBNY. With a nod to more hawkish market expectations following yet another outsized jump in consumer prices in May, the Federal Open Market Committee (FOMC) raised the target range for the federal funds rate by 75 bps to 1.5% to 1.75% at the past week’s meeting, thereby delivering the largest hike in administered rates since 1994. Moreover, per the new “dot plot” seen here, the policymakers lifted their median year-end 2023 expectation by a full percentage point to 3.75%. While a comparatively modest 37.5 bps reduction back to 3.375% is now anticipated over the course of 2024, the nominal federal funds is expected to remain above the 2.5% level that is considered neutral by Fed officials over the forecast horizon. Updated market pricing is now roughly in line with Fed projections near-term, suggesting that another 75 bps increase in the federal funds rate target range to 2.25%-2.5% will be delivered at the July 26-27 FOMC meeting.
CHART 2 UPPER RIGHT
Source: Bloomberg. While market pricing of Fed hikes aligns with the Fed’s new dot plot for 2022, here, it is evident that the market (via Fed Funds futures and OIS curves) lags the projections of the dot plot for 2023 and 2024. Likely the market prices a chance of an economic slowdown or recession in which the Fed will need to slow/stop hiking or even reverse hikes at that juncture. This dynamic will be interesting to monitor going forward.
CHART 3 LOWER LEFT
Source: Bloomberg. Note: Top pane is yield (%), bottom pane is change (bps). As of Friday afternoon, yields were again notably higher across the curve from the week prior, in a move led by shorter maturities. While the 10-year UST was ~10 bps higher, the 2-year UST was ~12 bps higher. Of note is that the 3 to 7-year curve sector is virtually flat, while the 10-year is inverted to shorter points. The week-on-week change understates the actual “ups and downs” and volatility witnessed during the week, per our following chart. The driver of the week was clearly the FOMC, and the Bank of England also hiked rates this past week, thereby again serving as a reminder that many global central banks are waging a fight vs. inflation. This week, Chair Powell declared that the Fed intends to “act forcefully” and sustain a “restrictive” policy if necessary. Meanwhile, mortgage rates have hit the highest levels (~5.8%) since 2008 due to the backup in yields of recent months. Close attention will be paid to Fed-speak, especially Powell’s Congressional appearance, this upcoming week for further insights on policy and rates.
CHART 4 LOWER RIGHT
Source: Bloomberg. This view of the 2-year SOFR swap fixed-rate, here using the past 5-day period in 15-minute increments, clearly depicts the ongoing high intraday and day-to-day volatility of the markets. Rate moves, owing to the FOMC meeting, were especially pronounced this past week. This rate traded in a range from ~3.16 to 3.54% before closing the week mid-Friday afternoon at ~3.30%. We encourage members to engage with the desk for information on potential market-moving events or data and/or to optimize potential borrowing and timing decisions.
FHLBNY Advance Rates Observations
Front-End Rates
- Short-end Advance rates finished higher by ~ 40 to 70 bps week-over-week, with shorter tenors leading the rise, owing to the Fed’s 75 bps hike in its policy rate along with the market’s re-pricing upwards of the policy path. Short-end markets remain volatile, thereby leading to dynamic intraday and day-to-day moves in rates. While there are large amounts of cash chasing limited supply in the front-end, the pricing of Fed hikes continues to pressure yields higher. As of this past Friday midday, the market priced for a high chance of another 75 bps hikes for the July 27th FOMC. And then a ~40% chance of another 75 bps hike is priced for the Sept. 21st FOMC. This pricing, and the fact that maturities are crossing further into the timeline of the Fed hiking cycle, contributed to the rate moves.
- Given the Fed tightening posture and upcoming FOMC meetings, rates will remain highly responsive to the market’s moves and pricing of the Fed.
Term Rates
- Longer term rates finished dramatically higher, week-over-week, generally mirroring the move in the UST market. While 1-year was ~42 bps higher, the 2-year was ~15 and 5-year ~10 bps higher. Kindly refer to the previous section for further color on relevant market dynamics.
- On the UST term supply front, this upcoming week contains 2 and 5-year Tips as well as a 20-year nominal bond auction. The focus will be on Fed-speak and Chair Powell’s appearance before Congress. The market is likely to remain volatile. Please call the Member Service Desk for information on market dynamics, rate levels, or products.
Product Alert: FHLBNY is pleased to announce enhancements to our Advance Rebate Program, which provides members an opportunity to receive a cash rebate when prepaying an eligible advance and rebooking a new advance within a 30-day period. Rebate-eligible advances now must have a minimum of 6-months (reduced from 1-year) remaining. Moreover, the potential cash rebate has been increased. This program can be suitable for those wishing to extend their liability duration and/or potentially improve net interest margin. Please call the Member Service Desk at (212) 441-6600 for more information.
Forward Start Advance (FSA): For members with upcoming borrowing or refunding plans, consider the FSA as a method to opportunistically “lock in” rates before advance settlement date. Please call the Member Service Desk at (212) 441-6600 for more information.
The Symmetrical Prepayment Advance Feature
With rates at or near multi-year lows, it is a compelling juncture to use the SPA feature on term advances. This feature allows member to capture, at prepayment, changes in the Fair Value of the advance which are favorable to the member. Contact us to discuss.
Looking for more information on the above topics? We’d love to speak with you!
Questions?
If you wish to receive the MSD Weekly Market Update in .pdf format (includes FHLBNY rate charts) or to discuss this content further, please email the MSD Team.