Member Services Desk
Weekly Market Update
Economist Views
Click to expand the below image.
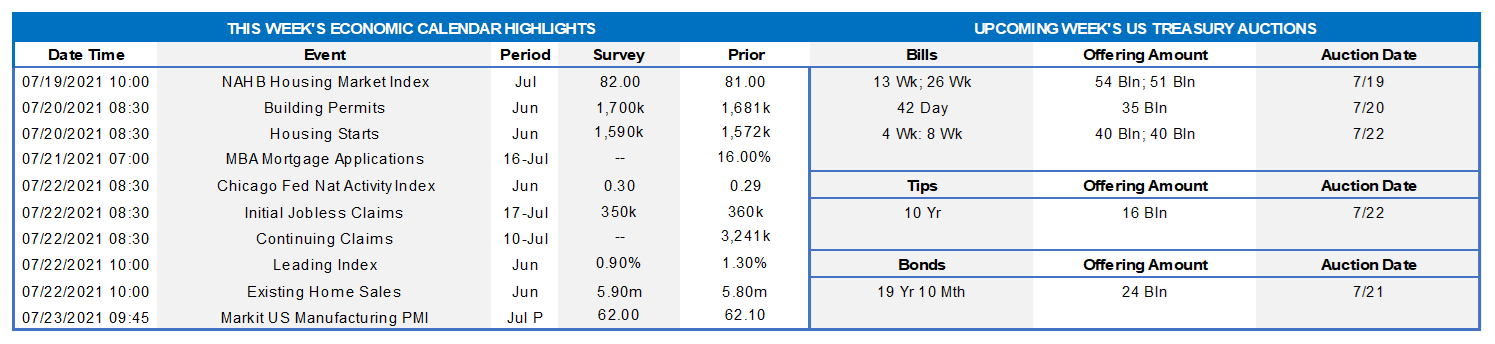
This week’s economic release calendar will be unusually light. Soundings on housing are universally expected to improve on their prior-period readings. Home-builder sentiment probably remained at a historically high level this month. New residential building activity likely perked up in June, while closings on existing dwellings climbed for the first time since the beginning of the year. Unemployment insurance figures are expected to move lower but remain well above levels experienced before the healthcare crisis struck. Supporting expectations that economic activity will remain solid over the course of the year, the index of leading economic indications probably climbed higher last month. There will be a complete pause in public appearances by Federal Reserve officials this week. The next FOMC is July 28th.
NAHB Housing Market Index: Marginally more upbeat appraisals of current and future sales, combined with an anticipated pickup in prospective buyer traffic, probably pushed the NAHB sentiment gauge one point higher to 82 in July, almost matching the 83-average posted over the first half of the year.
Housing Starts & Building Permits: Powered by anticipated pickups in both single- and multifamily activity, the number of new housing units started and building permits issued likely climbed slightly higher to annualized rates of 1.59mn and 1.7mn, respectively, in June.
Jobless Claims: Initial and continuing claims under regular state unemployment insurance programs likely remained on downtrends during their latest respective reporting periods. Those figures continue to overstate the recovery of the labor market from the pandemic, however. Indeed, as of June 26th , an estimated 13.8mn persons were receiving some sort of unemployment assistance, down from the pandemic peak of 32.4mn reached a year ago but still well above the 2.1mn prevailing before the healthcare crisis began. Using June’s level as a base, 8.6% of the civilian labor force were receiving some form of unemployment insurance payments two weeks ago.
Existing Home Sales: Contract signings over the April-May span suggest that existing home sales probably climbed by 2.8% to a three-month high seasonally adjusted annual rate of 5.96mn in June. With the number of dwellings on the market likely dipping by 100K to 1.22mn during the reference period, the stock of unsold homes is expected to remain at 2.5 months’ supply.
Leading Economic Index: The Conference Board’s barometer of future economic activity is expected to have climbed by .9% in June, after a pair of 1.3% advances in April and May. Recent soundings suggest that real GDP growth will remain brisk over the balance of 2021.
Click to expand the below images.
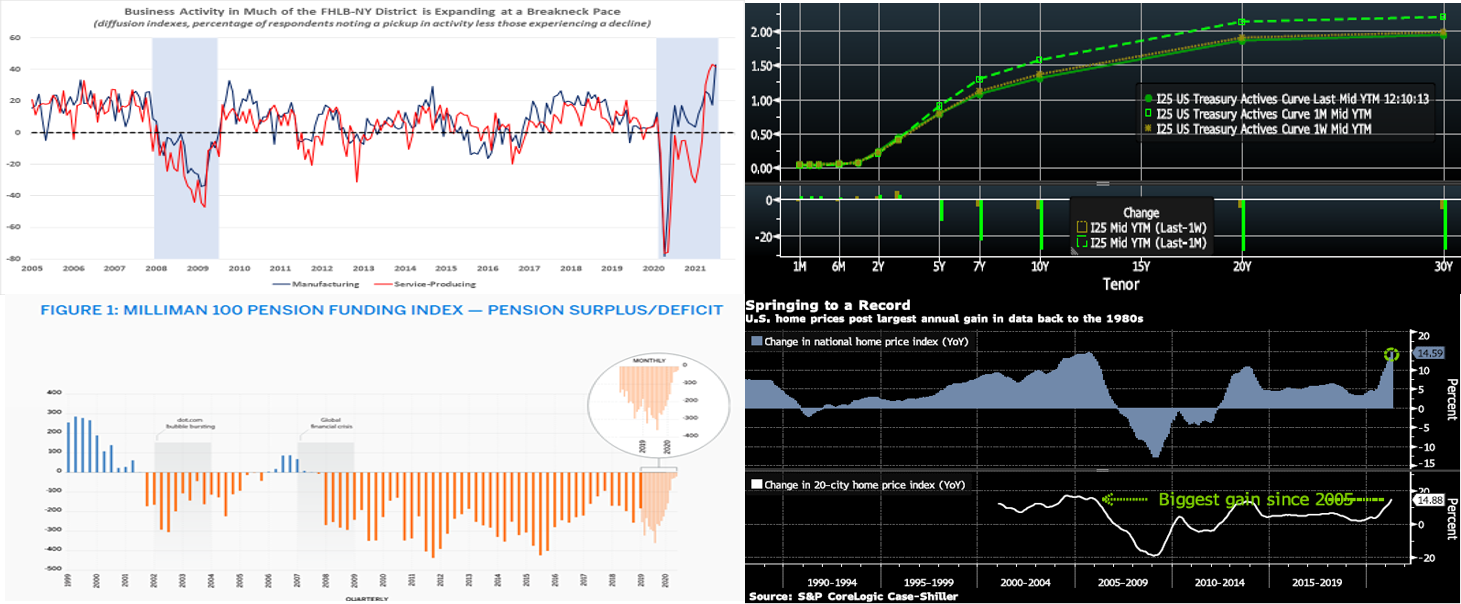
CHART 1 UPPER LEFT
Source: FRB-NY; FHLBNY. Shaded areas denote recessions. The NY Fed reported that economic growth in the Second District remained strong at the beginning of July, as low levels of COVID cases and widespread vaccinations have allowed most businesses to reopen. Additionally, contacts continued to express broad-based optimism about the business outlook. Factory activity is currently growing at a record-setting pace in New York State, according to the FRB-NY’s Empire State Manufacturing Survey. Indeed, the gap between the percentage of companies experiencing an improvement in general business conditions less those suffering a decline widened from 17.4% in June to an all-time peak of 43% in July. Service-sector activity is also surging. The business activity gauge in the FRB-NY’s Business Leaders Survey – a canvass of service-producing firms in NY, southwestern CT and northern NJ – retreated just slightly to 41.7% from the record high 43.2% posted in June.
CHART 2 UPPER RIGHT
Source: Bloomberg. Note: top pane is yield (%), bottom pane is change (bps). The curve trended a bit lower and flatter week-on-week and remains notably flatter since last month and the June 16th FOMC. As of midday Friday, UST yields were modestly changed if at all out to 5-year but a few bps lower in the 7-year and longer sector. Various forces have influenced the recent flattening. The market appears, despite strong inflation data this week, to be more comfortable with the Fed’s stance on inflation and that upticks will be transitory and/or the Fed will be “on top of it” via the removal of accommodation. Fed Chairman Powell’s appearance before Congress this week somewhat bolstered this theme, as he did not overly emphasize “transitory” when speaking on inflation. Concern about potential impacts from the increasingly threatening COVID Delta variant has also risen, especially its impact globally but also domestically too, thereby possibly leading to a more drawn-out national economic recovery. Short-covering and “steepener unwinds” have continued from market trading-type participants, and the Fed’s purchases as well as foreign demand (owing to anemic global yields) have provided consistent demand out the curve for now.
CHART 3 LOWER LEFT
Source: Milliman. A contributing factor to fixed income demand and curve flattening has been pension-relate buying. As seen here, the funded status of the 100 largest corporate defined benefit pension plans increased by $8bn in May, as measured by the Milliman (a risk management advisory firm) 100 Pension Funding Index (PFI) for June. The Milliman 100 PFI funded ratio increased to 98.8%, as of May 31, aided by investment gains. This leaves the top 100 US corporate defined pension benefit plans with over $1.8trn of asset value. With domestic pensions near fully-funded status for the first time since 2007, they have re-allocated assets and been significant buyers of US fixed income instruments, mostly in the longer part of the curve, in a trend that is expected to continue.
CHART 4 LOWER RIGHT
Source: S&P CoreLogic Case-Shiller, Bloomberg. While most are aware that housing markets are “hot”, shown here is the high degree. Low supply and mortgage rates, plus a recovering economy, have supported the sector. An increasing percentage of mortgages have been written for higher-FICO borrowers, thereby limiting the potential for a mid-2000’s type of bubble. Meanwhile, anecdotal stories in the media abound of “bidding wars” and “bids over asking” and/or with “all cash”. This chart, like many data points, reflects aggregate trends. Many folks do not possess the means to enter “bidding wars”. In this light, the importance of FHLB-NY’s Affordable Housing and Community Lending Programs is clear. Members should call the desk or visit our website to learn more about these programs.
FHLBNY Advance Rates Observations
Front-End Rates
- Short-end Advance rates finished unchanged on the week. Money Market Funds’ AUM declined further by ~$31bn this past week, somewhat sapping demand for paper, albeit some of that decline appears to be funds going directly to the RRP post the Fed’s rate adjustment last month. The overall supply/demand paradigm persists, however, as the GSEs continue to invest larger sums into money markets, the TGA continues its decline, and short-maturity paper is in short supply. In a more recent development, state and local governments are receiving federal disbursements from the most recent relief bill and are parking funds in short-term investment “placeholders”. For any members experiencing such municipal deposit inflows, consider our Refundable Municipal Letter of Credit product; please contact Member Services Desk to discuss.
- UST issuance overall is now net positive supply in that more is being issued than what the Fed is buying in its programs. However, with short UST rates at rock-bottom levels and the Fed on hold for a long period, rates are likely to persist in a near-term sideways pattern. Importantly, weekly net T-bill issuance has been lower since 2020 and negative in recent months, and Treasury intends to shift issuance out the curve. Moreover, the looming federal debt ceiling may further constrain issuance. More legislative packages and related borrowing may lead to an eventual increase of T-bill auction sizes and positive net supply, but for now overall market supply/demand dynamics should keep short rates in check from large moves to the upside.
Term Rates
- The Advance rate curve mildly flattened from a week prior. While the shorter maturities were unchanged to a few bps higher, those past 5-year were modestly changed to a few bps lower in progressive fashion out the curve. Kindly refer previous section for further color on relevant market dynamics.
- On the UST supply front, this week brings a 10-year TIPS and a 20-year nominal auction. It will be a relatively quiet data week.
New Product Alert: In order to satisfy member needs and provide greater product flexibility to match bond and derivative market conventions, FHLB-NY now offers SOFR-linked advances based on SOFR-index compounding. Note that this product is in addition to SOFR-linked advances based on SOFR-index averaging which have been offered since November 2018.
The Symmetrical Prepayment Advance Feature
With rates at or near multi-year lows, it is a compelling juncture to use the SPA feature on term advances. This feature allows member to capture, at prepayment, changes in the Fair Value of the advance which are favorable to the member. Contact us to discuss.
Looking for more information on the above topics? We’d love to speak with you!
Questions?
If you wish to receive the MSD Weekly Market Update in .pdf format (includes FHLBNY rate charts) or to discuss this content further, please email the MSD Team.
Special Member Alert
The FHLBNY recently announced a newly expanded and flexible Disaster Relief Funding (DRF) advance program which offers discounted rate advances with maturities 1-mo and greater. Additionally, we have announced that PPP loans will be accepted as eligible collateral. Please contact us with any questions.