Member Services Desk
Weekly Market Update
Economist Views
Click to expand the below image.
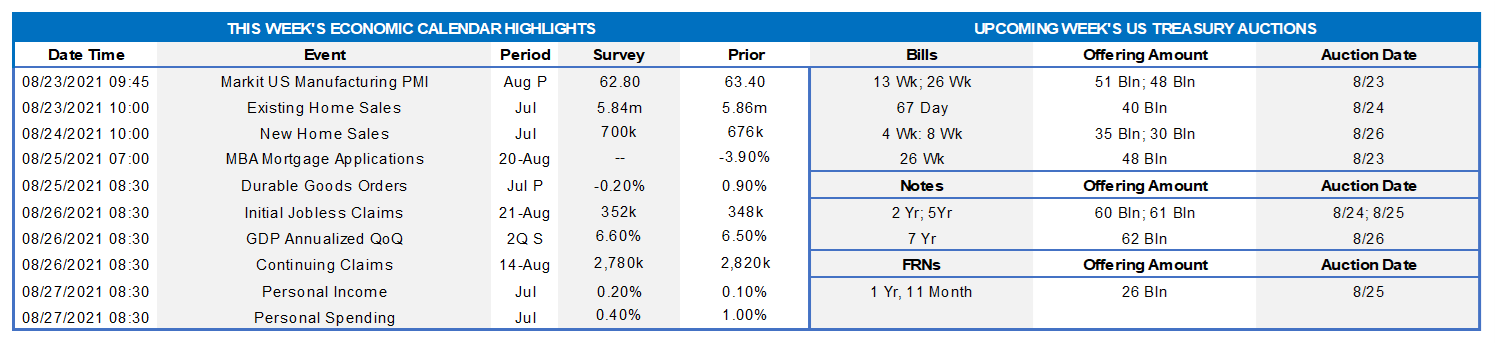
All eyes this week will be on the Federal Reserve Bank of Kansas City’s annual Economic Policy Symposium in Jackson Hole, Wyoming. This year’s theme will be Macroeconomic Policy in an Uneven Economy. Federal Reserve Chairman Powell will discuss the economic outlook via the Kansas City Fed’s YouTube channel on Friday, August 27th at 10:00 AM EDT. The full slate of keynote speeches that will be available to the public virtually, in real-time, will be provided closer to the event. While speculation has increased among market participants about an announcement of plans to taper the Fed’s asset-purchase program, this week’s conference is an unlikely venue. Indeed, policymakers probably prefer to get through the full cycle of key economic soundings for August, which, will be available before the September 21-22 meeting. On the data front, existing home sales probably rose modestly in July, while purchases of new dwellings were unchanged. Durable goods bookings are expected to be slightly lower in June. Weekly unemployment insurance metrics likely improved. Government statisticians may boost their estimate of Q2 real GDP growth. Consumer spending figures for July will provide important information on the dominant portion of GDP at the start of the summer quarter.
Existing Home Sales: Contract signings over the May-June period span hint that existing home sales rose by 1.4% to a four-month high seasonally adjusted annual rate of 5.94mn in July. With available dwellings on the market probably dipping by 300K to 1.22mn during the reference period, the stock of unsold homes likely moved one tick lower to 2.5 months’ supply.
New Home Sales: Contracts to buy a newly constructed dwelling likely were little changed at a seasonally adjusted annual rate of 675K in July.
Durable Goods Orders: Pared by a projected pullback in transportation equipment bookings, durable goods orders probably dipped by .2% last month, reversing a portion of the .9% gain recorded in June. Excluding the projected decline in transport requisitions, “hard goods” bookings are expected to have edged .4% higher, almost matching the prior-month .5% rise. Last month’s nondefense capital goods shipments excluding commercial jet deliveries may prompt economists to tweak their estimates of the potential contribution of business equipment spending to Q3 real GDP growth.
Jobless Claims: Initial and continuing claims under regular state unemployment insurance programs likely retreated during their latest respective reporting periods. Those figures continue to overstate the improvement in the labor market from the worst of the pandemic, however. Indeed, as of the week ended July 31, 11.7mn persons were receiving some sort of unemployment assistance, down from the pandemic peak of 32.4mn reached a year ago but still well above the 2.1mn prevailing before the shuttering of the economy. Using July’s level as a base, 7.3% of the civilian labor force were receiving some form of unemployment insurance payments three weeks ago.
Real GDP: Data released since the Bureau of Economic Analysis’ advance report suggest that spring-quarter growth may be boosted slightly from the initially estimated 6.5% annualized pace.
Personal Income & Spending: Personal income likely edged .2% higher in July, following a .1% uptick in the prior month. Capped by already reported pullbacks in retail goods purchases, nominal consumer spending is expected to have risen by .4%, after a 1% jump in June.
Federal Reserve Appearances:
- Aug. 26-28 Jackson Hole Economic Policy Symposium hosted by the Federal Reserve Bank of Kansas City.
Click to expand the below images.
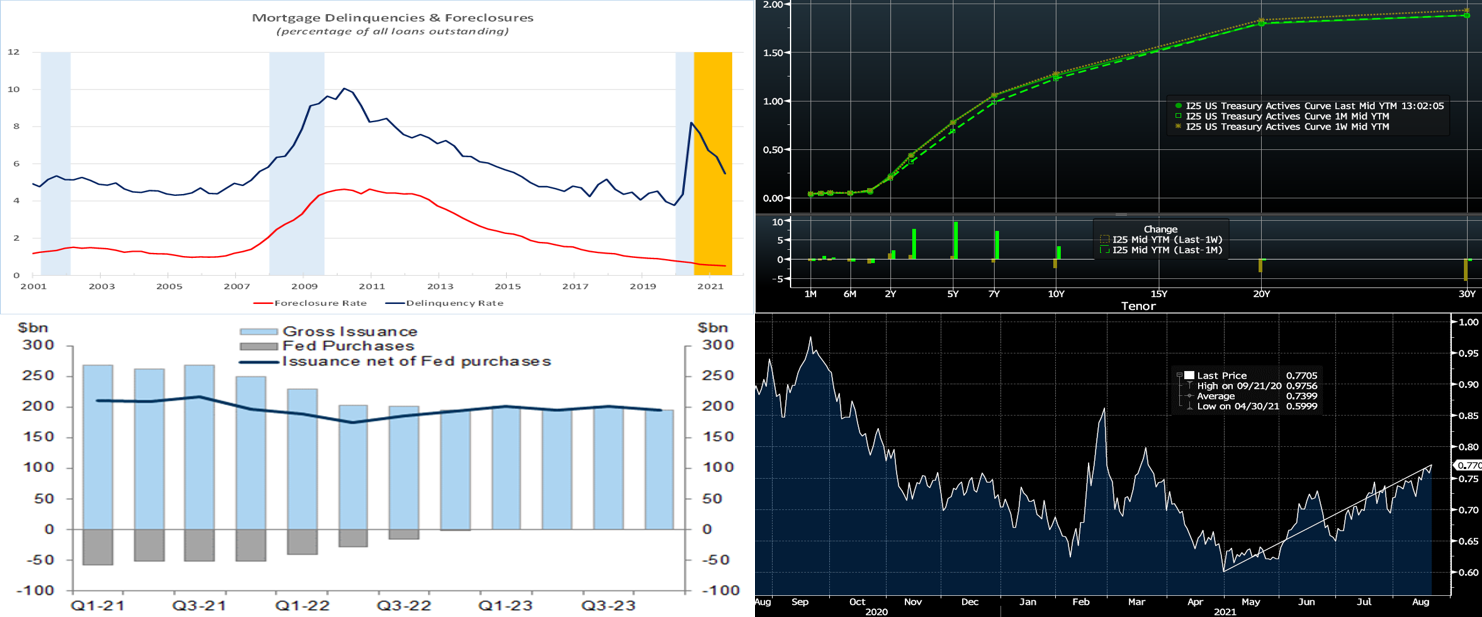
Source: Mortgage Bankers Association, National Bureau of Economic Research ; FHLBNY. Note: Blue-shaded areas denote recession. Orange-shaded area denotes current expansion. Mortgage performance metrics are on the mend. The delinquency rate nationwide retreated to 5.47% from 6.38% during Q2. Despite that improvement, delinquencies remained above the 3.77% in Q4 2019 before the pandemic struck. Seriously delinquent loans – those 90 days or longer past due – declined from 4.7% in Q1 to 4.03% during the spring, still more than double the 1.76% witnessed before the pandemic. The foreclosure rate dipped by 3 bps to .51% — the lowest level since Q4 1981. Delinquency rates in New Jersey and New York remained, respectively, the fourth and seventh highest among the 50 States. Seriously delinquent loans in the Garden State fell by 89 bps to 5.65%, while foreclosures dipped by 6 bps to 0.96%. In the Empire State, seriously delinquent loans dropped by 239 bps to 4.72%, with foreclosures falling by 133 bps to just .34%.
CHART 2 UPPER RIGHT
Source: Bloomberg. Note: top pane is yield (%), bottom pane is change (bps). Yields finished modestly mixed across the curve on the week. After trading lower earlier in the week on a weaker-than-expected retail sales report, yields gradually retraced higher into the end of the week. Week-over-week as of midday Friday, the 2 to 5-year sector closed marginally higher in yield, whereas the rest of the curve closed lower by a few bps. The market appears to be in somewhat of a late summer stalemate between the onset of a Fed taper of securities purchases and improving jobs data on the one side, but the persistent COVID-Delta variant threat and weaker global economic data on the other side. The market will closely follow the upcoming week’s Jackson Hole gathering for a better guide on the economy and Fed policy timelines, while also monitoring vaccination rates and their potential to curb the variant’s impact on the economy.
CHART 3 LOWER LEFT
Source: Goldman Sachs Research. Depicted here is forecasted UST supply (“Gross Issuance”) vs. Fed purchases (in 10-year duration equivalents, monthly averages). While the latest FOMC Minutes and recent Fed Governors’ comments indicate that an announcement of a taper is on the close horizon timeline-wise, the actual impact of the taper may be modest this time around, as compared to the notorious “taper tantrum” and spike in yields of 2013. Besides being much expected at this juncture by the market, the potential for yields to significantly rise as a result of decreased Fed demand may be blunted by a lower supply of UST issuance next year. As seen here, Goldman, as do some other securities dealers, expect UST issuance to decrease slightly and level off next year. As a result, a modest decline and leveling-off of net UST duration supply (“Issuance net of Fed purchases”) could occur and thereby serve to, all else equal, somewhat neuter the taper’s impact.
CHART 4 LOWER RIGHT
Source: Bloomberg. Depicted here is the Agency MBS Current Coupon (computed yield of a par-priced bond) spread (RHS, %) to the average of the UST 5 and 10-year yield. Per the trend line, it has moved higher since the Spring, at least in part owing to the closer onset of a Fed taper plus debate on MBS potentially being the first sector to be tapered. In this light, the market appears expectant of the taper, and so a violent reaction ala 2013 would seem to be unlikely. Meanwhile, any further rise in spreads or rates would be welcome developments for bank portfolios and net interest figures.
FHLBNY Advance Rates Observations
Front-End Rates
Short-end Advance rates finished a bp lower out to 2-month and unchanged thereafter on the week. Money Market Funds’ AUM increased by ~$14.8bn this past week, thereby infusing demand for short paper and the Fed’s RRP. The overall supply/demand paradigm persists in suppressing rate levels, as the GSEs continue to invest large sums into money markets, the TGA continues its decline, and short-maturity paper is in short supply. The Fed’s RRP facility continues to experience strong demand.
UST issuance overall is now net positive supply in that more is being issued than what the Fed is buying in its programs. However, with short UST rates at rock-bottom levels and the Fed on hold, rates are likely to persist in a near-term sideways pattern. Importantly, weekly net T-bill issuance has been lower since 2020 and negative in recent months, and Treasury intends to shift issuance out the curve. Moreover, the looming federal debt ceiling may further constrain issuance. Further legislative packages and related borrowing may lead to an eventual increase of T-bill auction sizes and positive net supply, but for now overall market supply/demand dynamics should keep short rates in check from large moves to the upside.
Term Rates
The Advance rate curve was mixed from a week prior. Rates out to 5-year were roughly unchanged to a bp higher, while the 6 to 10-year sector closed 2 to 3 bps lower. Kindly refer to the previous section for further color on relevant market dynamics.
On the UST supply front, this week brings 2/5/7-year auctions. The market will monitor economic data and especially the Jackson Hole symposium for any Fed officials’ pronouncements regarding the taper of bond purchases.
Product Enhancement Alert: FHLBNY this past week announced an enhancement to the Callable Adjustable Rate Credit Advance (“Callable ARC”). The product features a 1-time call/cancel option (member’s option) to extinguish funding early at no cost via two distinct option structures, thereby giving members flexibility in meeting the demands of a fluctuating balance sheet. Given the shorter-term nature of the current borrowing environment, the minimum term for the Callable ARC has been lowered to 4-month (from the previous 7-month) for our 1-month-left-to-maturity call option (SOFR or 1-month Libor index available) to better meet our members’ needs. Meanwhile, the 3-year Non-Call 2-year product for SOFR continues to be offered to members for their longer-term needs.
New Product Alert: In order to satisfy member needs and provide greater product flexibility to match bond and derivative market conventions, FHLB-NY now offers SOFR-linked advances based on SOFR-index compounding. Note that this product is in addition to SOFR-linked advances based on SOFR-index averaging which have been offered since November 2018.
The Symmetrical Prepayment Advance Feature
With rates at or near multi-year lows, it is a compelling juncture to use the SPA feature on term advances. This feature allows member to capture, at prepayment, changes in the Fair Value of the advance which are favorable to the member. Contact us to discuss.
Looking for more information on the above topics? We’d love to speak with you!
Questions?
If you wish to receive the MSD Weekly Market Update in .pdf format (includes FHLBNY rate charts) or to discuss this content further, please email the MSD Team.
Special Member Alert
The FHLBNY recently announced a newly expanded and flexible Disaster Relief Funding (DRF) advance program which offers discounted rate advances with maturities 1-mo and greater. Additionally, we have announced that PPP loans will be accepted as eligible collateral. Please contact us with any questions.