Member Services Desk
Weekly Market Update
This MSD Weekly Market Update reflects information for the week of July 11, 2022.
Economist Views
Click to expand the below image.
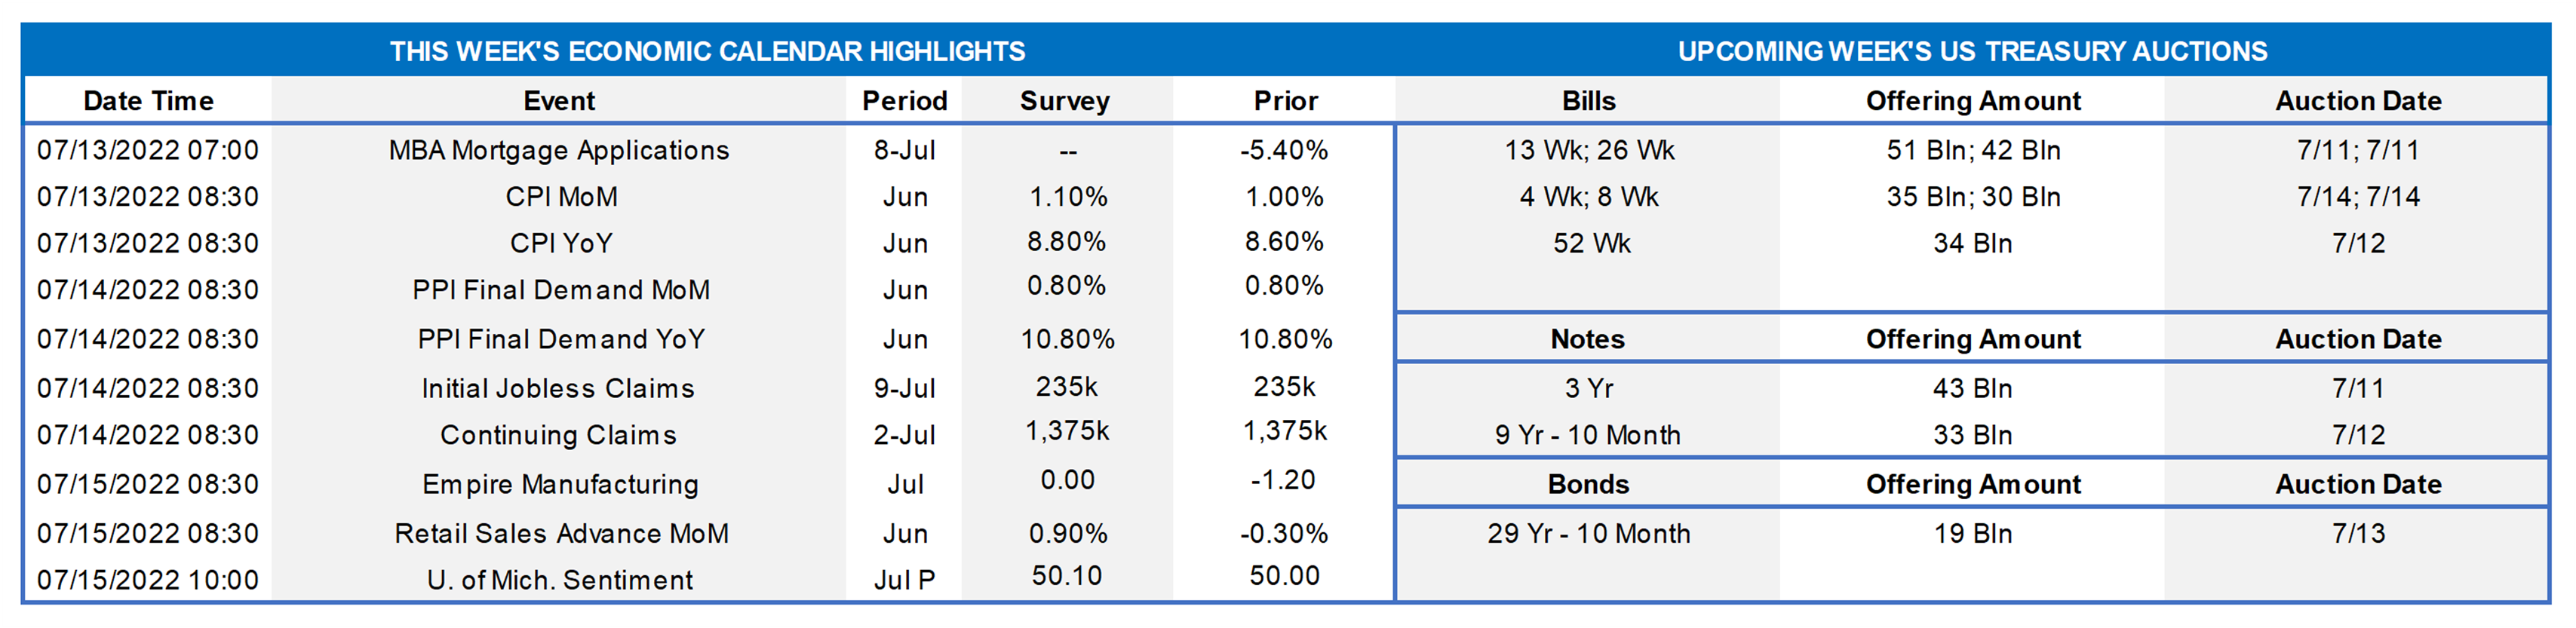
Market participants will experience a relatively quiet economic release calendar this upcoming week, following a holiday-shortened week that revealed modestly hawkish June-FOMC minutes and a strong June jobs data report on Friday. All due this upcoming week, June reports on consumer prices, producer prices, retail sales, and consumer sentiment will allow economists to continue to track where the economy is headed. As of this writing, the consensus anticipates CPI to be higher than last month’s reading, and PPI to be flat to the prior month. Retail Sales are expected to rebound vs. June’s negative figure. Rounding out the calendar is the closely watched University of Michigan consumer sentiment figure. Given the Fed’s focused fight vs. inflation, the inflation data is likely to be the week’s highlight and potential market-mover.
CPI MoM: CPI is expected to inch a bit higher compared to the May reading.
CPI YoY: CPI YoY is expected to show an increase vs May – demonstrating the strong inflationary environment consumers are experiencing.
PPI Final Demand MoM: Producer price increases for June are expected to be flat to May.
PPI Final Demand YoY: PPI YoY is expected to be flat to the prior reading from May, still a very hot 10.8%.
Initial Claims/Continuing Claims: On the heels of a strong Non-Farm Payroll report, new and continuing claims are expected to remain relatively flat to the prior week.
Empire Manufacturing: The Empire Manufacturing figure is expected to rebound slightly from its negative reading for June.
Retail Sales: Retail Sales for June is expected to show a strong rebound from the May negative figure.
University of Michigan Sentiment: The sentiment index last month was the weakest on record for several decades. It is not expected to show much improvement this month.
Federal Reserve Appearances:
- July 11 New York Fed President John Williams will take part in a discussion on the Libor transition.
- July 12 Richmond Fed President Thomas Barkin to speak on the ‘Recession Question’.
- July 14 Fed Governor Christopher Waller to discuss the economic outlook.
- July 15 Atlanta Fed President Raphael Bostic to discuss Monetary Policy and Global Uncertainty at an event hosted by the Tampa Bay Business Journal.
Click to expand the below image.
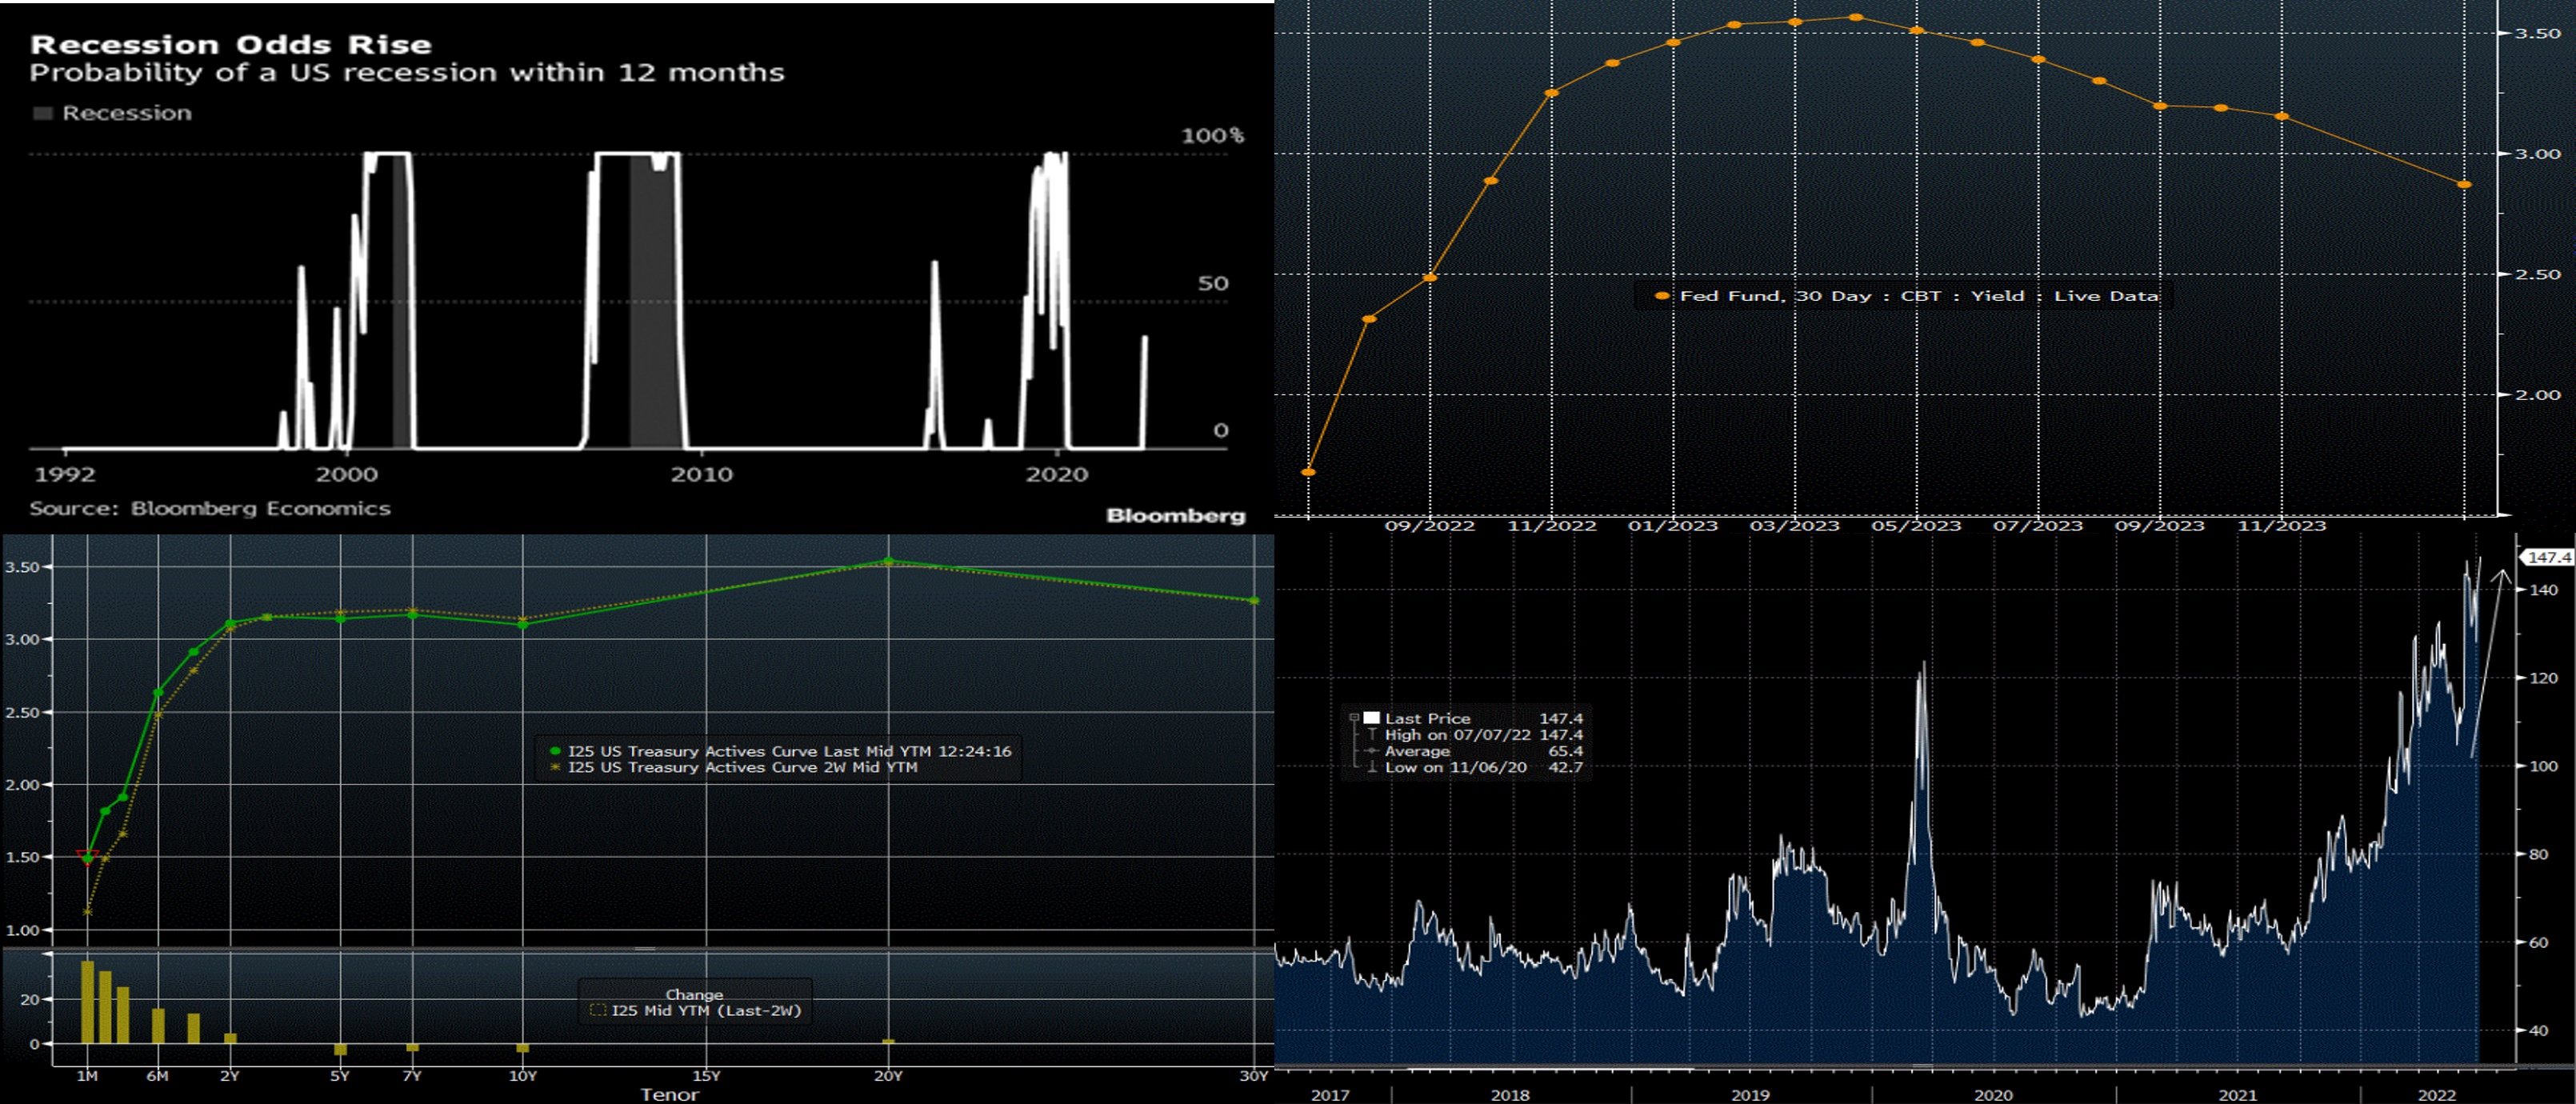
CHART 1 UPPER LEFT
Source: Bloomberg. According to the Bloomberg Economics group this past mid-week, the odds of a US recession within the next 12 months have risen to ~38% (RHS). This latest forecast came after some recent worse-than-expected consumer sentiment data and the dramatic rise in rates of recent months. Various market strategists and economists likewise have raised their recession probabilities to or near this zone. Naturally, such forecasts should be taken in context, as market prognosticators are often either incorrect or subsequently update projections. And the economy could undergo a slowdown, rather than an outright recession. Indeed, this past Friday’s strong jobs report does not forebode impending recession and may knock these recession probabilities down a notch. An important takeaway for ALM and scenario analysis, however, is that the market has already priced Fed hikes into the curve, and, at this stage, is now looking ahead and gauging/pricing a potential economic slowdown (and lower rates) in the future.
CHART 2 UPPER RIGHT
Source: Bloomberg. Shown here is the Fed Funds Effective futures curve (RHS, %), as of this past Friday morning. To help illustrate the above comments, here can be seen that the market prices aggressive Fed hikes over the next 6 months, culminating in a peak of ~3.55% in April 2023. Thereafter, the path subsides and declines; essentially, the market prices for a strong probability that the Fed will need to halt and eventually reverse policy tightening. This market pricing is a primary reason for the current extremely flat (or inverted, at some points) yield curve. And constant changes in this Fed pricing are also a primary causal factor of the large swings and volatility of rates of the past few months.
CHART 3 LOWER LEFT
Source: Bloomberg. Note: Top pane is yield (%), bottom pane is change (bps). When comparing this past midday Friday UST yield curve to that of two weeks ago (our last edition), there is minimal change, except clearly for the very short-end tenors which are now further into the Fed’s hiking cycle timeline. Yet this woefully belies the actual rate movements over the period. Between June 24th and July 6th, for instance, the 5-year traveled from ~3.19% to ~3.31% (June 28th) and then down to ~2.76% early-morning on the 6th. Subsequently, it reversed course to trade ~3.13% as of this writing on midday Friday. After some weak data in the pre-holiday week, this past week witnessed stronger-than-expected jobs data as well as the relatively hawkish release of June’s FOMC Minutes. And a few FOMC members were on the speaking circuit advocating for a 75 bps hike this month and amplifying the Fed’s focus on inflation-fighting. These developments conspired to influence yields higher.
CHART 4 LOWER RIGHT
Source: Bloomberg; Deutsche Bank. As mentioned above and frequently in our recent editions, market volatility has increased notably in recent months. Depicted here is the Deutsche Bank “Gamma” index, basically an index representing implied volatility levels of short-dated expiration swaptions (options on interest rate swaps). After subsiding late-May, it has surged higher again and is at the highest level in years. The higher levels increase the cost of purchasing option-based hedges, given that implied volatility is a primary component of calculating an option price. And the high levels are symbolic of the day-to-day and intraday moves in rates (including advance rates) experienced in recent weeks. We continue to encourage members to contact the desk for updates on market dynamics and rate levels; importantly, the volatility can sometimes serve to present opportunities for more optimal entry levels on transactions.
FHLBNY Advance Rates Observations
Front-End Rates
- Short-end Advance rates finished higher and steeper from our last edition two weeks ago, with 1-month up 16 bps and 6-month up 21 bps. Short-end markets remain volatile, more so in the longer tenors, thereby leading to some dynamic moves in rates. While there are large amounts of cash chasing limited supply in the front-end, the pricing of Fed hikes continues to pressure yields higher. As of this past Friday midday, the market priced for just shy of a 100% chance of another 75 bps hikes for the July 27th FOMC. And then a 50 bps, with ~25% chance of another 75 bps, hike is priced for the Sept. 21st FOMC. This pricing, and the fact that maturities are crossing further into the timeline of the Fed hiking cycle, contributed to the rate moves.
- Given the Fed tightening posture and upcoming FOMC meetings, rates will remain highly responsive to the market’s moves and pricing of the Fed.
Term Rates
- Longer-term rates finished modestly changed from two weeks ago (our last edition), generally mirroring the move in the UST market. But movements during the time period were notable. Kindly refer to the previous section for relevant market color. The curve is very flat and offers opportunities to extend in advance duration for minimal if any (and, at some points, potentially less), coupon cost.
- On the UST term supply front, this upcoming week contains 3/10/30-year auctions. The focus will remain on Fed-speak and the economic data slate, especially this week’s inflation releases. The market is likely to remain volatile. Please call the Member Service Desk for information on market dynamics, rate levels, or products.
Product Alert: FHLBNY is pleased to announce enhancements to our Advance Rebate Program, which provides members an opportunity to receive a cash rebate when prepaying an eligible advance and rebooking a new advance within a 30-day period. Rebate-eligible advances now must have a minimum of 6-months (reduced from 1-year) remaining. Moreover, the potential cash rebate has been increased. This program can be suitable for those wishing to extend their liability duration and/or potentially improve net interest margin. Please call the Member Service Desk at (212) 441-6600 for more information.
Forward Start Advance (FSA): For members with upcoming borrowing or refunding plans, consider the FSA as a method to opportunistically “lock in” rates before advance settlement date. Please call the Member Service Desk at (212) 441-6600 for more information.
The Symmetrical Prepayment Advance Feature
With rates at or near multi-year lows, it is a compelling juncture to use the SPA feature on term advances. This feature allows member to capture, at prepayment, changes in the Fair Value of the advance which are favorable to the member. Contact us to discuss.
Looking for more information on the above topics? We’d love to speak with you!
Questions?
If you wish to receive the MSD Weekly Market Update in .pdf format (includes FHLBNY rate charts) or to discuss this content further, please email the MSD Team.