Member Services Desk
Weekly Market Update
This MSD Weekly Market Update reflects information for the week of April 11, 2022.
Economist Views
Click to expand the below image.
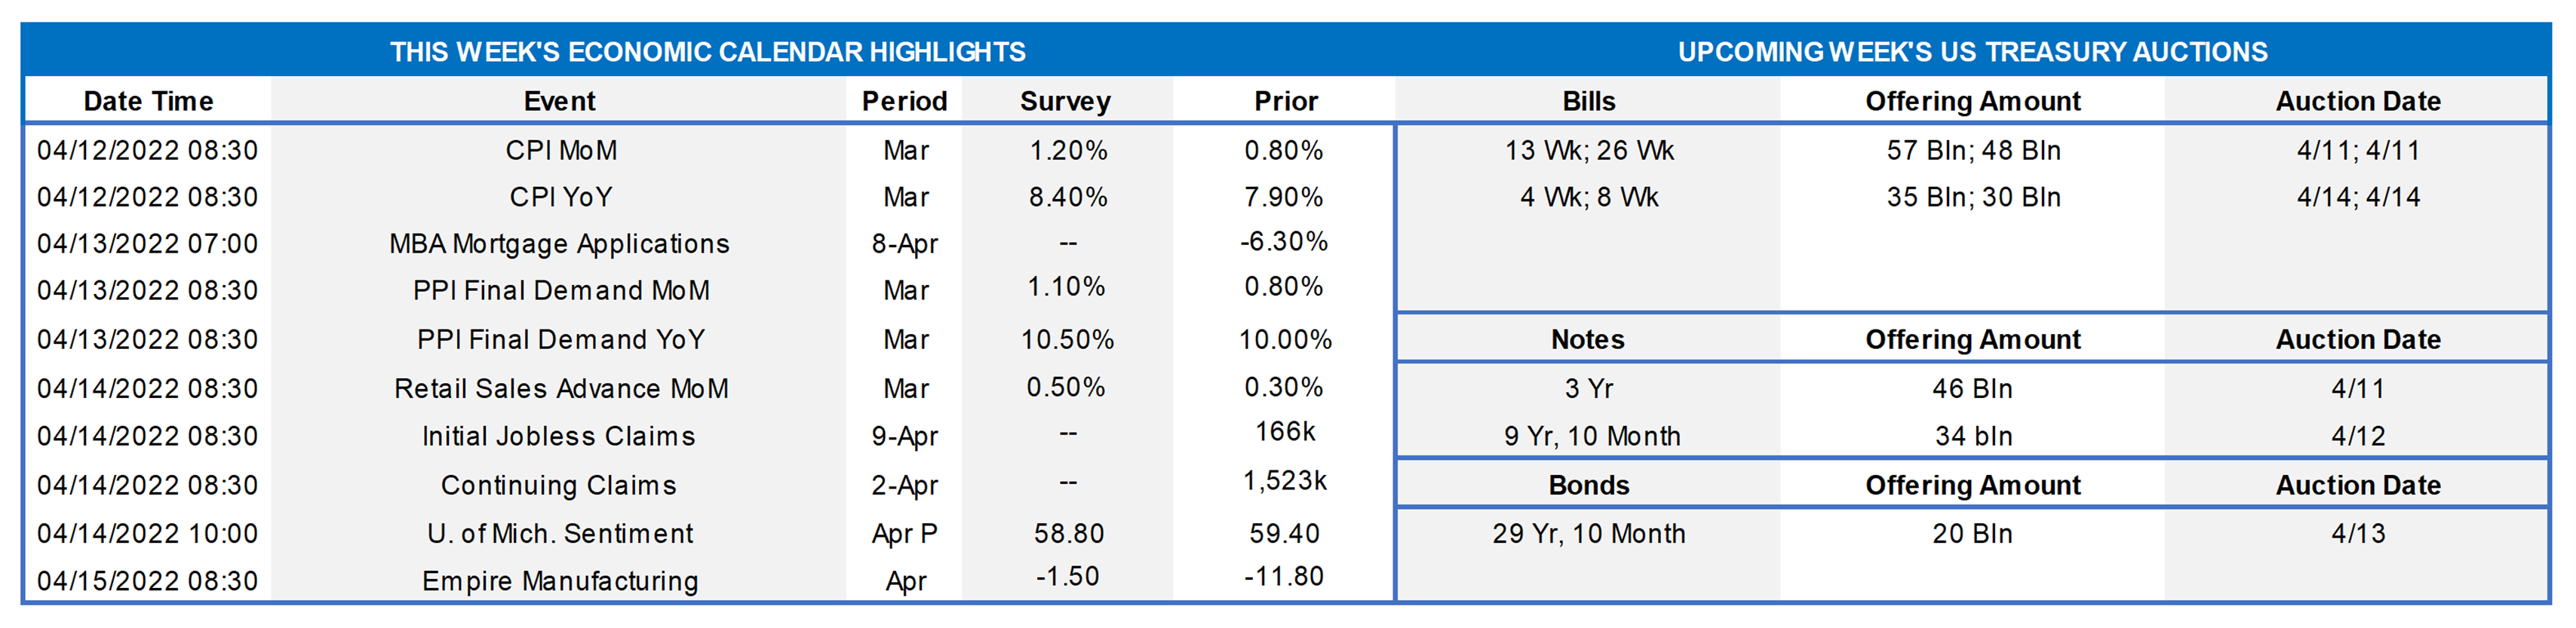
While keeping an eye on Ukraine news, the markets will contend with a crowded statistical calendar this week. Consumer prices are expected to have accelerated sharply in March, raising the probability of a 50 bps hike in the target range for the federal funds rate at the May 3-4 FOMC meeting. Reports on retail sales and industrial production last month likely will prompt economists to tweak their tracking estimates for Q1 real GDP growth, currently centered at 1.5% annualized. A quintet of Fed officials is slated to offer thoughts on the economy and monetary policy prospects.
NFIB Small Business Optimism Index: Buoyed by upbeat labor-market soundings, the confidence gauge, to be released on the 12th, likely climbed from the 95.7 reading recorded in February.
Consumer Price Index: Increased costs for energy products and food probably propelled CPI 1.2% higher in March – the largest one-month rise since September 2005. Capped by an anticipated decline in used motor vehicle prices, the core CPI excluding volatile food and energy items likely edged .4% higher, following a .5% February rise. Those forecasts, if realized, would leave the overall and core CPIs a whopping 8.3% and 6.5% above their respective year-ago levels, both well above the Federal Reserve’s desired 2% target.
Retail & Food Services Sales: Despite a reported decline in auto purchases, retail and food services sales likely rose by .6% in March, double the prior-month gain. Net of a projected .2% dip in auto-dealership revenues, retail sales are expected to have climbed by .8% during the reference period, following a modest .2% increase in February. As always, market participants will pay particular attention to so-called control sales excluding auto, building materials, and gasoline purchases. Barring any prior-month revisions, the .6% rise anticipated by the Street would leave core purchases over the January-March span a hefty 18% annualized above their October-December average, after a 5.9% Q4 gain.
Jobless Claims: With available positions eclipsing the number of jobless persons by a historically wide margin, initial and continuing state unemployment insurance claims likely moved lower.
Michigan Sentiment Index: Growing concern about current and prospective economic conditions probably left the consumer confidence gauge at 58.5 in early April – the lowest since August 2011.
Empire State Manufacturing Survey: The manufacturing expansion in New York State likely resumed in April, after the surprising pullback witnessed in March. The net percentage of survey respondents experiencing a pickup in general business conditions is expected to improve to 3.0% from -11.8% in the previous month.
Industrial Production & Capacity Utilization: To be released on the 15th, production at the Nation’s factories, mines, and utilities are expected to have risen by .4% in March, following a .5% prior-month gain. With output likely eclipsing additions to productive capacity during the reference period, the overall operating rate likely rose by .3 percentage point to 77.9% – the highest level since March 2019.
Federal Reserve Appearances:
- Apr. 11 Atlanta Fed President Bostic to make opening remarks at a Fed Listens event in Nashville, TN.
- Apr. 11 Chicago Fed President Evans to discuss the economy and monetary policy at the Detroit Economic Club.
- Apr. 12 Richmond Fed President Barkin will speak to the Money Marketeers of New York.
- Apr. 14 Cleveland Fed President Mester to discuss workforce development and the Fed at the Ohio Economic Forum.
- Apr. 14 Philadelphia Fed President Harker to give a speech on the economy and job market at Rider University, New Jersey.
Click to expand the below image.
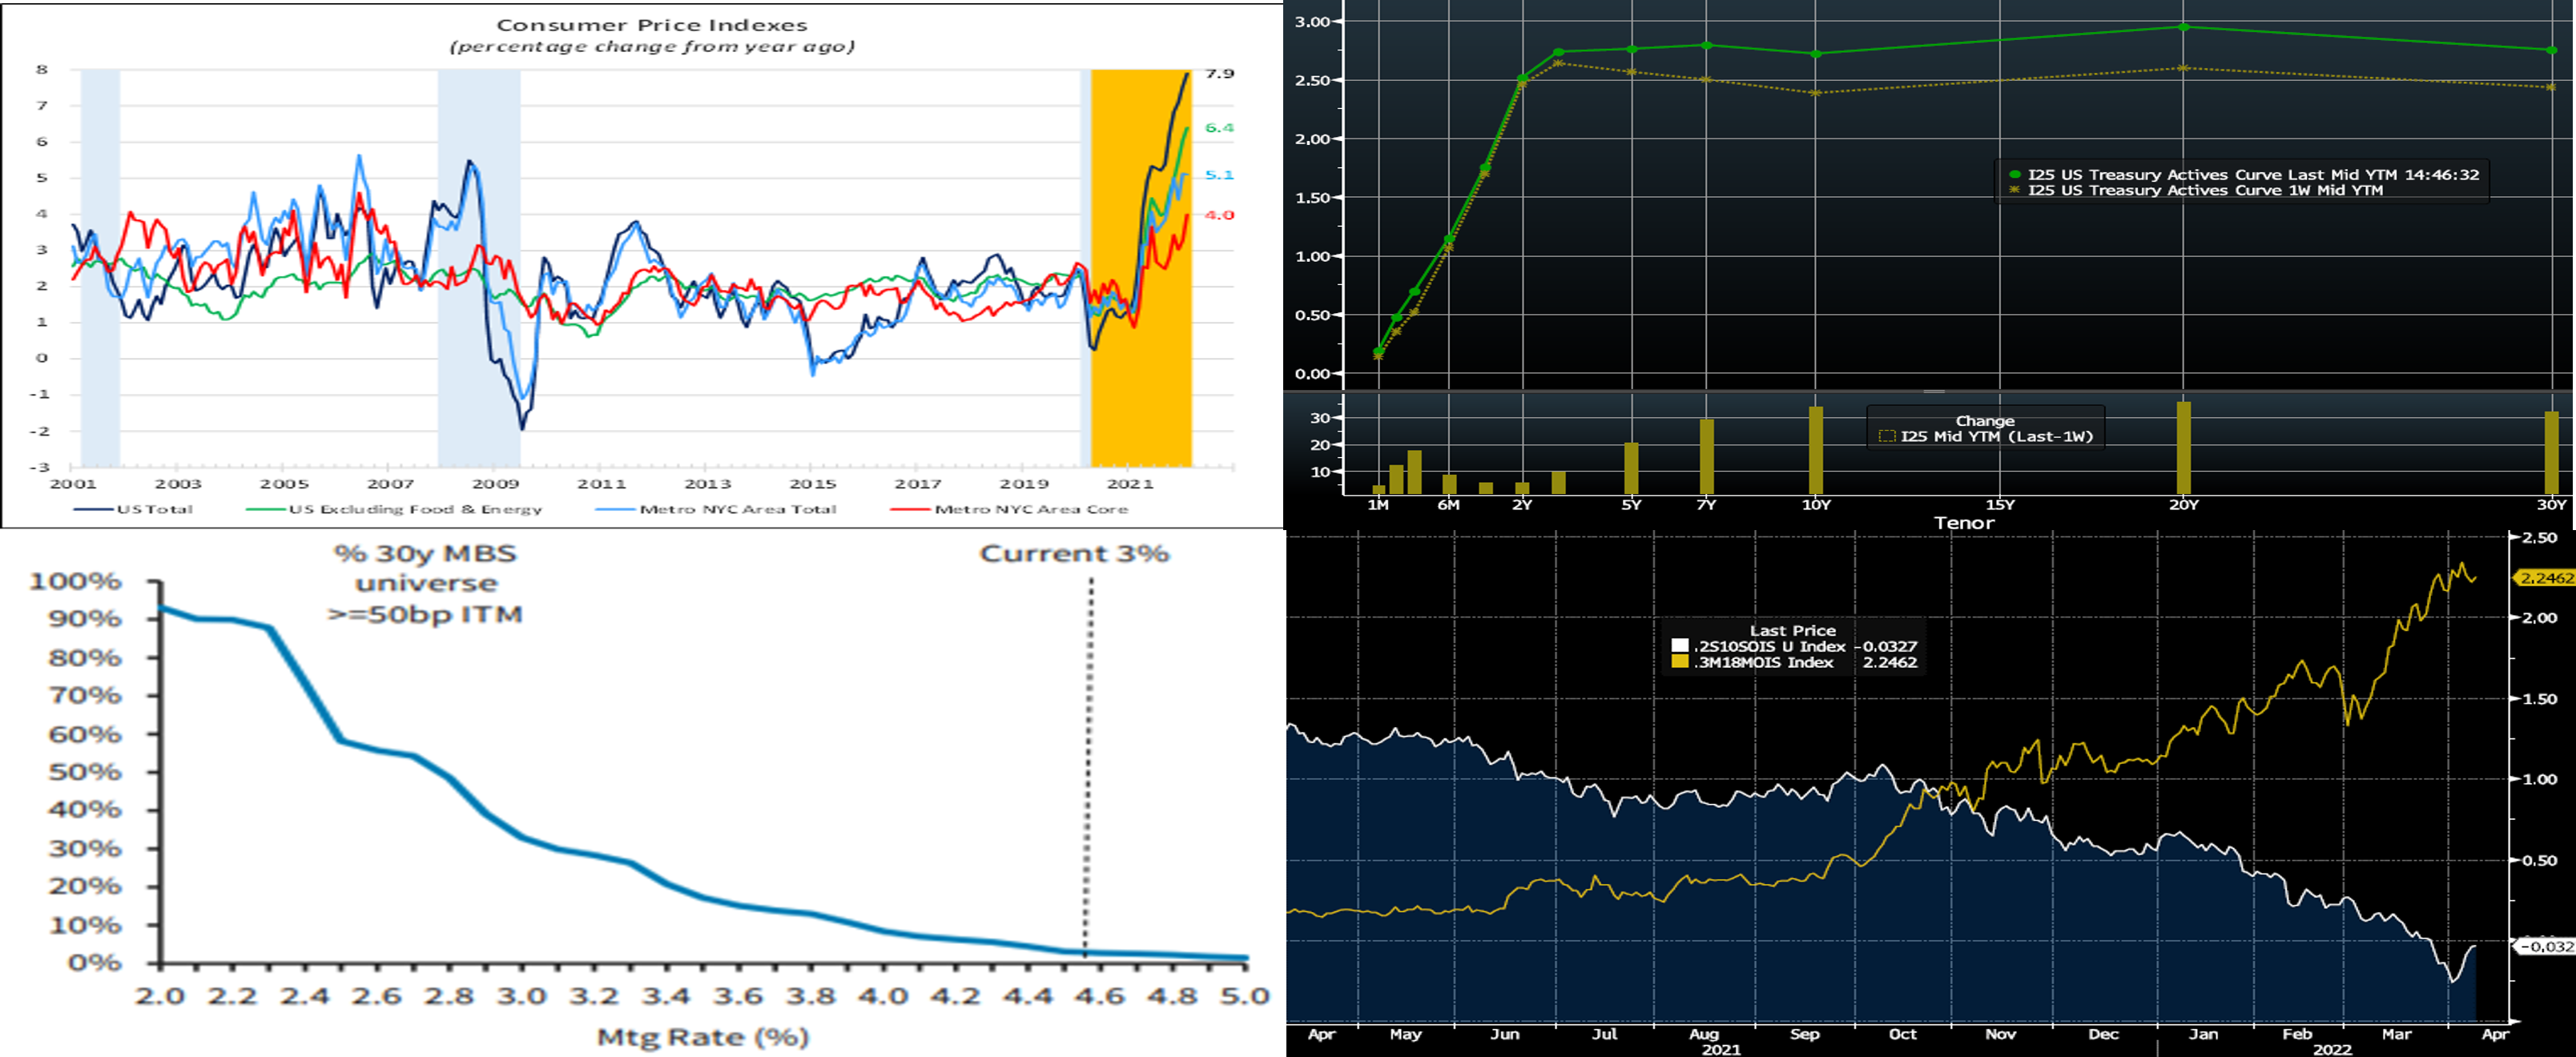
CHART 1 UPPER LEFT
Source: Bureau of Labor Statistics; NBER; FHLBNY. Given recent hawkish comments from Fed officials, the BLS’ update on consumer prices in March will be the data focus of the week. Consumer costs for goods and services across the country soared by 7.9% over the 12 months ended February and by 6.4% when volatile prices for food and energy are excluded. While elevated, retail inflation has been comparatively subdued across the NYC metropolitan area. Local goods and services prices have risen by 5.1% since February 2021, while core consumer costs have climbed by 4%. One of the forces capping inflation across the NYC metro area, relative to nationally, has been local shelter costs. This component, accounting for about one-third of the overall CPI, has edged just 1.9% higher in the area and so considerably slower than the 4.7% gain witnessed nationwide.
CHART 2 UPPER RIGHT
Source: Bloomberg. Note: Top pane is yield (%), bottom pane is change (bps). The UST yield curve notably steepened week-over-week. Yields were up across the board, but the 5-year and longer sector clearly led the move. Much of the move occurred on Tuesday in reaction to headlines from Fed Vice-Chair Brainard, generally considered one of the Fed’s “doves”, in which she declared that the Fed could shrink its balance sheet at a rapid pace as early as this May. Due to large amounts of maturities in the Fed’s portfolio in May, this comment drew sharp attention. Another factor contributing to the curve’s bearish steepening, while highly uncertain on timing, has been about the Fed potentially selling MBS. Given that natural runoff may be slow, due to lower prepayments owing to higher rate levels, the Fed may need to consider sales at some point. The market now prices for ~90% chance of a 50 bps hike at both the May 4 and June 15th FOMC meeting; for the rest of 2022, it prices for ~233 bps of cumulative hikes from the current level. The Russian invasion of Ukraine remains in the news but is not leading to any doubt on the Fed’s intention to march onwards with rate hikes. Indeed, the inflation impacts of the war have dominated concerns. In this regard, market focus will be on this week’s CPI data as well as any Fed-speak.
CHART 3 LOWER LEFT
Source: Barclays. The rise in rates of recent months has pushed the vast bulk of the MBS market out of the refinancing zone. As seen here, only ~3% (LHS) of the market has a 50 bps or greater inventive to refinance. With homebuyer mortgage rates now ~4.75% and seemingly pushing towards 5%, this percentage is now likely a tad lower than 3%. The convexity risk of the mortgage market has thereby become lower in a further rise in rates from here, as most of the duration extension has already occurred.
CHART 4 LOWER RIGHT
Source: Bloomberg. Back on April 1st, the UST 2-year/10-year curve reached an inversion of ~ -7 bps (note that it subsequently re-steepened to ~+20 bps as of midday Friday). In recent weeks, debate has ensued regarding this narrowing spread as a signal of a looming recession on the intermediate horizon. Fed Chair Powell, a few weeks ago, cited a different yield curve spread as a potentially better reference/predictor, based on Fed economic research, for recession and/or reversals of rate hikes, namely that of the 3-month vs. 3-month 18-month forward slope. In this chart, we show these yield curve slopes (note that Overnight Indexed Swaps are used here, for ease of charting). While the 2-year/10-year spread (RHS, White, %) may flash recessionary signals, the 3-month 18-month forward spread (RHS, Gold, %) is quite steep and thereby not flashing such signals. Attempting to accurately predict economic or rate cycles is tricky at best; the wisest course of action is to incorporate all potential scenarios into strategic planning and forecasting.
FHLBNY Advance Rates Observations
Front-End Rates
- Short-end Advance rates finished generally higher and markedly steeper week-over-week. For instance, whereas 1-month was up 3 bps, the 6-month was 19 bps higher. While the market continued to experience “safety flows” into very short instruments, the market’s ongoing aggressive pricing of forthcoming Fed hikes have served to push advance rates higher. As of midday Friday, the market priced for ~90% probability of 50 bps hikes at both the May 4 and June 15th FOMC. This pricing and the fact that maturities are crossing further into the timeline of the Fed hiking cycle, were causal factors in the rate moves.
- At this stage, all maturities lie within upcoming FOMC meetings, thereby making them highly responsive to the market’s moves and pricing of the Fed.
Term Rates
- The advance rates curve generally mimicked the UST curve week-over-week and bear steepened from the week prior. For instance, while the 2-year was ~10 bps higher, the 10-year was ~34 bps higher. Kindly refer to the previous section for relevant market color. While our advance curve may have lost previous points of inversion, it is still notably flat, particularly from 3 to 5-year and from 6 to 8-year. This condition may provide a compelling opportunity to extend liability duration at minimal coupon increase.
- On the UST term supply front, this upcoming week brings 3/10/30-year auctions. Longer-end rates have faced upward pressure in the past week, as some market strategists anticipate that the Fed, as part of its balance sheet runoff (“QT”), may need to sell MBS, especially given slower prepayment rates on MBS in the higher rate climate; timing on such remains highly uncertain, however. Markets and rates remain highly prone to move on Ukraine news and Fed-speak. Given market volatility, members should monitor conditions for potentially more optimal timing on transactions. Please call the Member Service Desk for information on market dynamics, rate levels, or products.
Product Alert: FHLBNY is pleased to announce enhancements to our Advance Rebate Program, which provides members an opportunity to receive a cash rebate when prepaying an eligible advance and rebooking a new advance within a 30-day period. Rebate-eligible advances now must have a minimum of 6-months (reduced from 1-year) remaining. Moreover, the potential cash rebate has been increased. This program can be suitable for those wishing to extend their liability duration and/or potentially improve net interest margin. Please call the Member Service Desk at (212) 441-6600 for more information.
Forward Start Advance (FSA): For members with upcoming borrowing or refunding plans, consider the FSA as a method to opportunistically “lock in” rates before advance settlement date. Please call the Member Service Desk at (212) 441-6600 for more information.
The Symmetrical Prepayment Advance Feature
With rates at or near multi-year lows, it is a compelling juncture to use the SPA feature on term advances. This feature allows member to capture, at prepayment, changes in the Fair Value of the advance which are favorable to the member. Contact us to discuss.
Looking for more information on the above topics? We’d love to speak with you!
Questions?
If you wish to receive the MSD Weekly Market Update in .pdf format (includes FHLBNY rate charts) or to discuss this content further, please email the MSD Team.