Member Services Desk
Weekly Market Update
This MSD Weekly Market Update reflects information for the week ending September 15, 2023.
Economist Views
Click to expand the below image.
The FOMC meeting will be the marquee event this coming week. Policymakers are expected to leave the target range for the federal funds rate unaltered at 5¼% to 5½%. Given the continuing string of positive data surprises, the post-meeting communiqué likely will reiterate that the economy is expanding at a moderate pace. The statement probably will repeat that job gains have been robust in recent months, the unemployment rate is low, and inflation remains elevated. Consistent with the current data dependency of monetary policy, the communiqué can be expected to omit any forward guidance on the prospective direction of administered rates. The statement likely will point out once again that in determining the extent of future increases in the target range, policymakers will consider the cumulative tightening of monetary policy, the lags with which monetary policy affects economic activity and inflation, and economic and financial developments. A wide range of information, including readings on labor market conditions, inflation pressures and inflation expectations, and financial and international developments will continue to be monitored in assessing monetary policy. The FOMC will continue to reduce its holdings of USTs, agency debt and agency MBS, as described in the Plans for Reducing the Size of the Federal Reserve’s Balance Sheet that was issued last year. To date, runoffs of maturing securities have pared the System Open Market Account, or SOMA, to $7.49trn from the $8.495trn peak reached in July 2022. As per convention, an updated Summary of Economic Projections, or SEP, will be released containing initial projections for the federal funds rate and key economic variables in 2026.
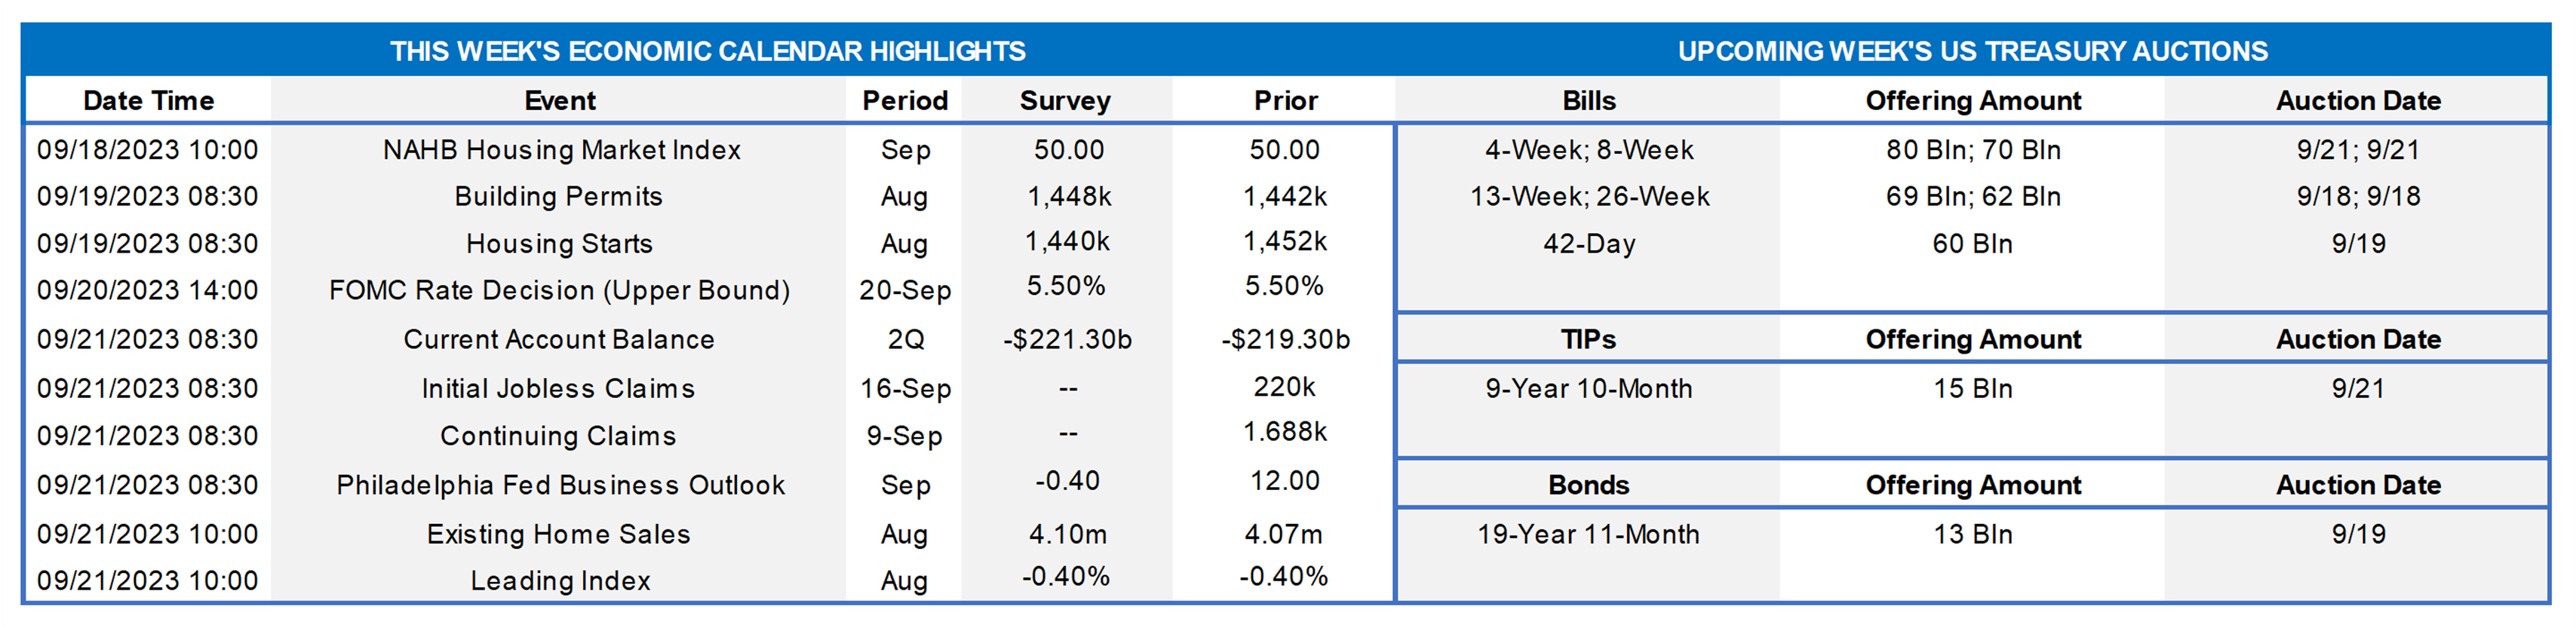
NAHB Housing Market Index: Homebuilders’ appraisals of current and prospective sales probably remained stable in early September, leaving this index at a neutral 50-point reading for a second straight month.
Housing Starts & Building Permits: Buoyed once again by favorable weather conditions, the number of building permits issued and new housing units started probably improved upon their respective 1.443mn and 1.452mn annualized rates set in July.
Current Account Balance: The current account deficit is expected to have clocked in at $221.3bn during the spring quarter, a slight deterioration from the $219.3bn shortfall posted over the first three months of the year.
Jobless Claims: Initial claims for unemployment benefits likely remained in a 215K-230K range during the filing period ended September 16, following the 220K posted in the prior week. Keep an eye on continuing claims for any signs that furloughed employees are having a more difficult time finding work.
Existing Home Sales: A modest increase in home-purchase contract signings over the June-July span suggests that closings on existing dwellings edged .7% higher to a seasonally adjusted annual rate of 4.1mn in August. With the number of homes on the market expected to contract by 1.8% to 1.09mn on a not seasonally adjusted basis during the reference period, the months’ supply at the estimated sales pace would edge two ticks higher to 3.3 months.
Leading Index: The Conference Board’s augur of prospective economic activity is expected to have fallen by .4% in August, following a similar dip in July and continuing a string of uninterrupted declines going back to April 2022. Despite its continuing weakness, the Federal Reserve Bank of St. Louis placed the probability that the economy was contracting in July at a negligible .8%.
Federal Reserve Appearances:
- Sept. 20: FOMC monetary policy statement.
- Sept. 20: Federal Reserve Chair Powell to hold post-meeting press conference.
- Sept. 22: San Francisco Fed President Daly to participate in a discussion on inflation, monetary policy, and the economy.
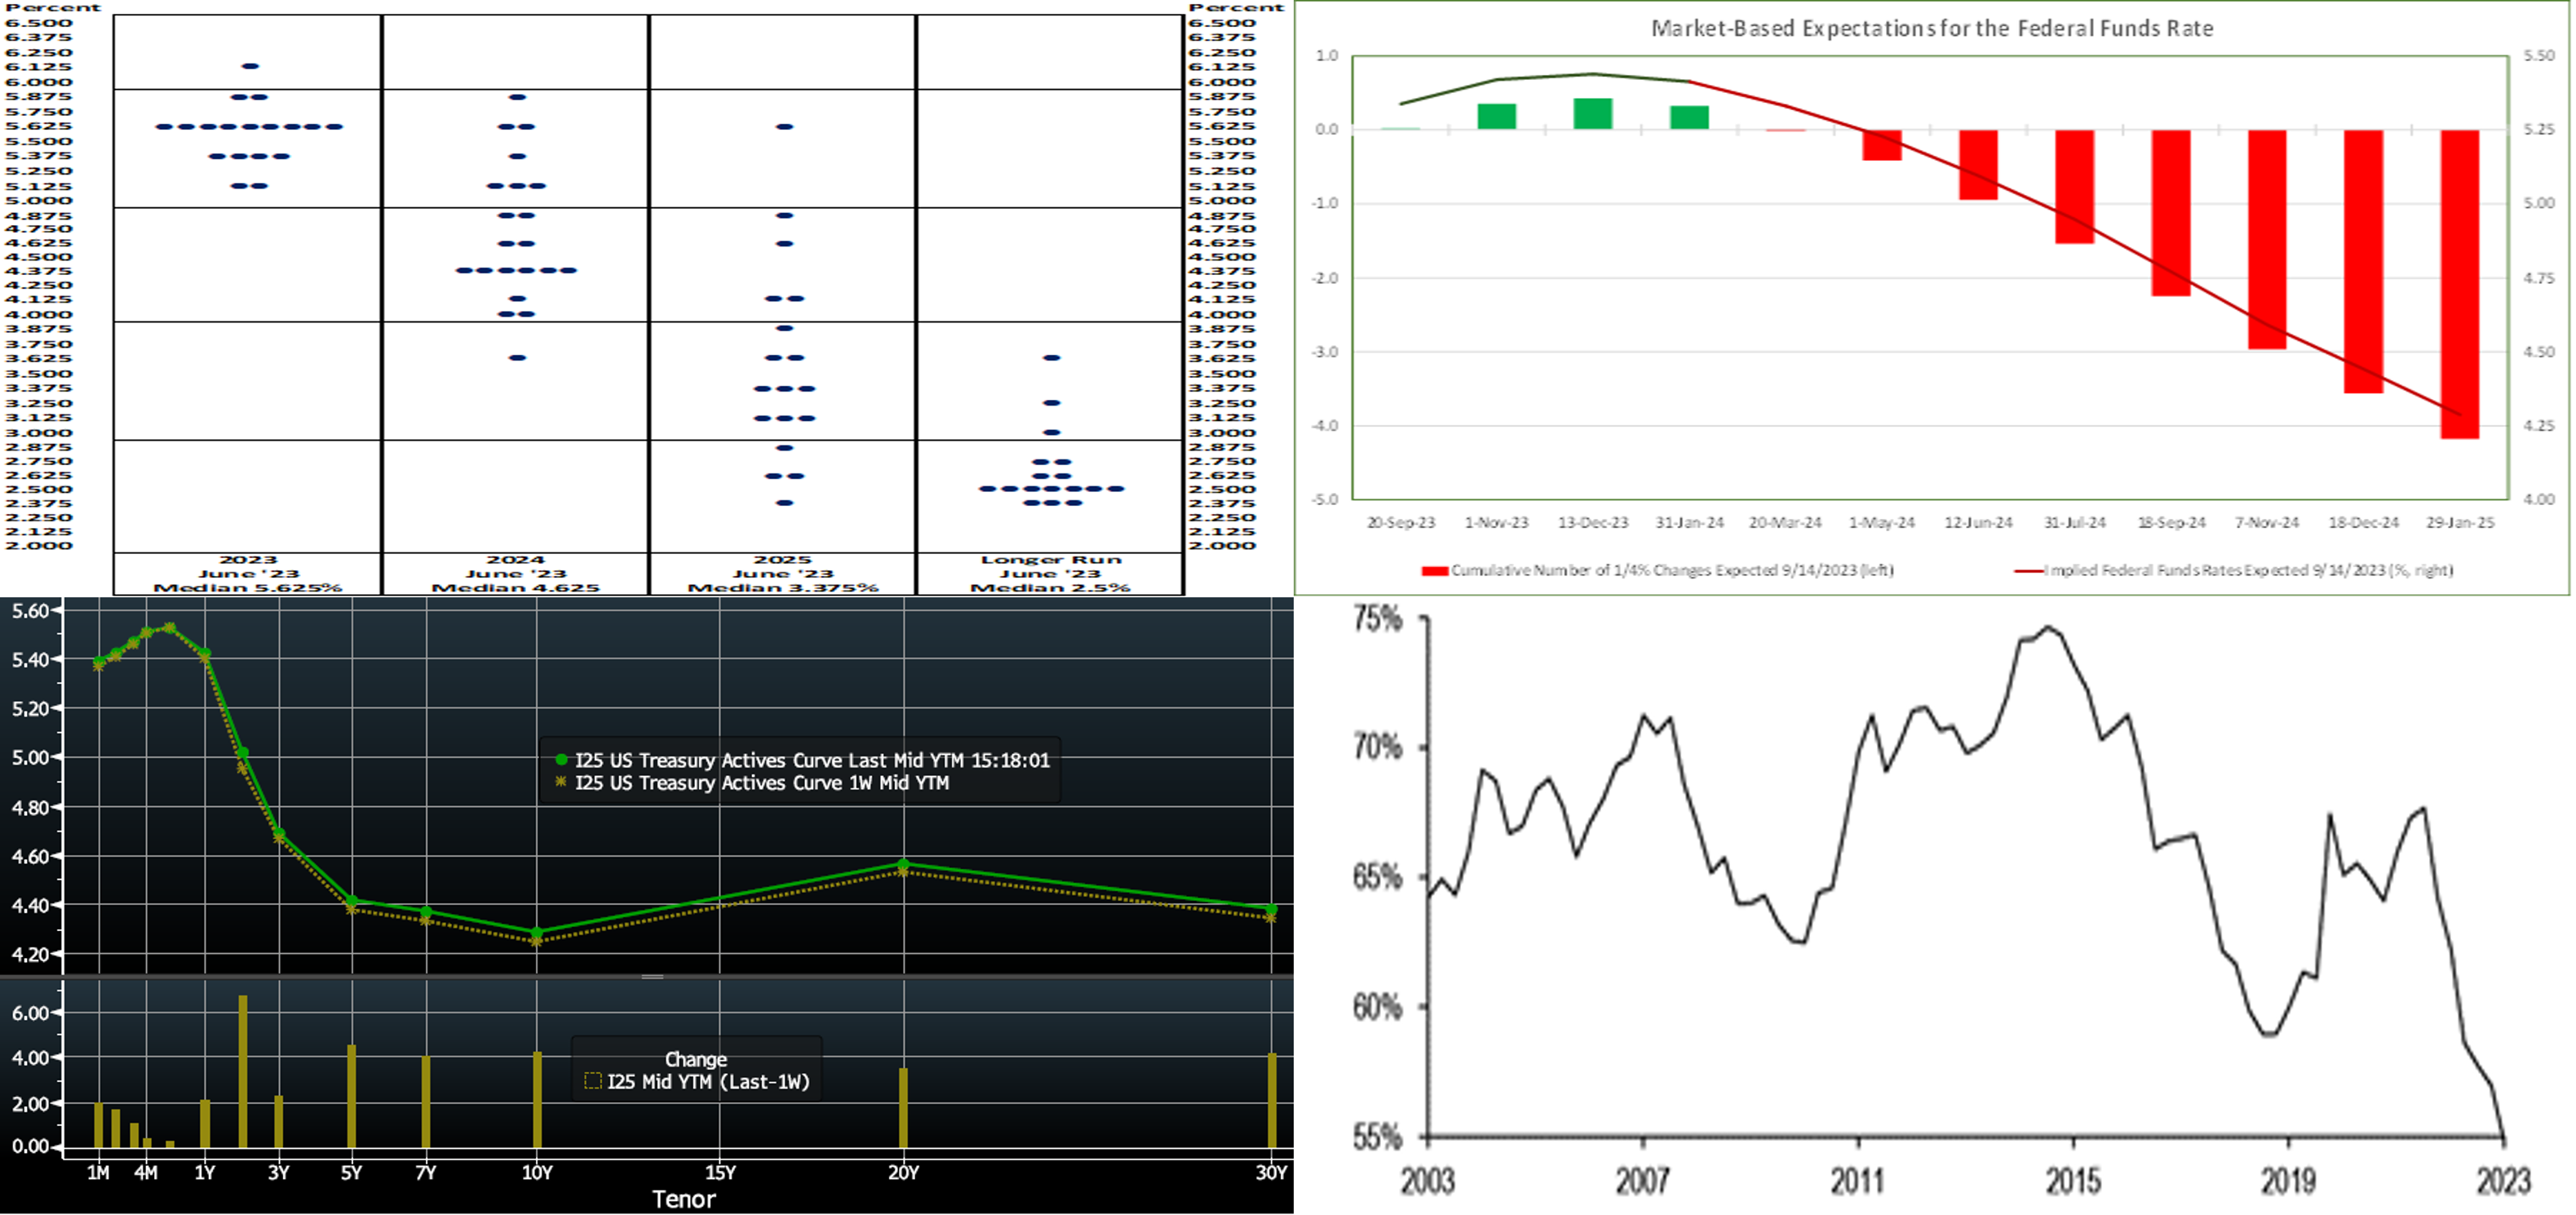
CHART 1 UPPER LEFT AND CHART 2 UPPER RIGHT
Source: Bloomberg; Federal Reserve; FHLB-NY. As per convention, the Federal Reserve will release an updated Summary of Economic Projections, or SEP, following the upcoming week’s meeting. With the federal funds rate target now just 25 basis points shy of policymakers’ median year-end 2023 projection, the so-called “dot plot” will be watched very closely for any changes to their expectations over the 2024-2025 horizon. In contrast to the June SEP plot shown here (see left-side chart), which anticipated sizable reductions over the next two years, the September edition likely will convey the message that they now expect the federal funds rate target range to remain higher for longer. The September SEP will also include initial forecasts for the federal funds rate and key economic variables in 2026. Market-based expectations of the prospective rate path (see right-side chart), which have recently converged to those of Federal Reserve officials in June, may reprice higher as a result. Consequently, the FOMC is the marquee event of the week, even if they, as expected, stand pat on an actual rate move.
CHART 3 LOWER LEFT
Source: Bloomberg. Top pane is yield (LHS, %), bottom pane is change (LHS, bps). From last Thursday afternoon to this one, the UST curve, adjusted for new on-the-run notes (3, 10, 30-year), is modestly higher. The 2 and 3-year yield are ~6 bps higher, while yields further out the curve were ~4 bps higher. Yields edged nearer to but still ~6 to 8 bps below the multi-year highs reached in August. The market largely shrugged off this week’s economic data, including the CPI release. In terms of market-implied pricing of the Fed, the 2023 peak Fed Funds rate moved from November to December and now stands at ~5.45%, little changed on the week. Essentially, the market is pricing ~48% chance of another 25 bp hike this year. The years 2024 and 2025 moved higher from a week ago, with the year-end 2024 forward ~13 bps higher, at 4.46%. The market eagerly awaits the upcoming FOMC meeting. Please call the Member Services Desk for further information on market dynamics and/or products.
CHART 4 LOWER RIGHT
Source: Federal Reserve; JPM. Shown here is the combined share (LHS, %) of marketable UST debt outstanding held by the Fed’s SOMA (System Market Open Account), US commercial banks, and foreign entities. As can be seen, an ongoing shift in the nature of UST demand is underway. Over the last two decades, these three investor types comprised roughly two-thirds or more of the ownership of the UST market. But this share has declined in recent years, especially the last two, to ~55% as of spring this year. With the Fed and banks continuing to pare securities holdings, this trend should persist and will do so amidst increased UST supply projections. In essence, especially with the Fed not buying, the UST demand-side has been veering towards more price-sensitive investors. In turn, all else equal, this dynamic could lead to higher market volatility and more extreme reactions (and overreactions) to data releases going forward. Members should keep this in mind when planning transactions and also aim to take advantage of opportunities presented by market moves to obtain more optimal rates and thereby help NIM. As a reminder, we are ready to transact well before the Daily Rate Sheet hits inboxes each morning.
FHLBNY Advance Rates Observations
Front-End Rates
- Short-end rates were generally unchanged or down a bp from a week ago. Net T-bill supply remains positive, given announcements from the Treasury regarding upsized auctions and issuance needs. But the supply continues to be absorbed well as Money Market Funds (MMFs) switch from the Fed’s RRP to T-bills with competitive yields. Moreover, FHLB supply has subsided from peak levels of spring, further assisting T-bill interest from investors and thereby containing any severe upward pressure on rates from T-bill supply. MMFs currently stand at or near all-time high AUM levels.
- The upcoming week’s FOMC meeting should be the main event near-term.
Term Rates
- The longer-term curve, generally mirroring the moves in USTs and swaps, was 2 to 5 bps higher in the 5-year-and-in zone, led by the 2 and 3-year tenors; longer tenors were relatively unchanged to slightly higher. The advance curve remains inverted out to 5-year, thereby offering opportunities to extend in duration at lower coupon cost. Kindly refer to the previous section for relevant market color. We continue to experience keen demand for putable advances; call the Member Services Desk to learn more.
- On the UST term supply front, the upcoming week serves a 20-year nominal and a 10-year TIPS auction. Note that UST auctions usually occur at 1pm and can cause volatility near that time. Please contact the Member Services Desk for further information on market dynamics, rate levels, or products.
Price Incentives for Advances Executed Before Noon – In effect as of Tuesday, September 5, 2023 – The FHLB-NY is pleased to now offer price incentives for advances executed before Noon each business day. These pricing incentives offer an opportunity to provide economic value to our Members, while improving cash and liquidity management for the FHLBNY. For further details, kindly refer to the bulletin.
Forward Start Advance (FSA): For members with upcoming borrowing or refunding plans, consider the FSA as a method to opportunistically “lock in” rates before advance settlement date. Please contact the Member Services Desk at (212) 441-6600 for more information.
The Symmetrical Prepayment Advance Feature
For those anticipating term funding needs, and with rates on an uptrend, it can be an appropriate juncture to consider our SPA feature. This feature allows the member to capture, at prepayment, changes in the fair value of the advance which are favorable to the member. Contact Member Services Desk to discuss.
Looking for more information on the above topics? We’d love to speak with you!
Questions?
If you wish to receive the MSD Weekly Market Update in .pdf format (includes FHLBNY rate charts) or to discuss this content further, please email the MSD Team.