Member Services Desk
Weekly Market Update
This MSD Weekly Market Update reflects information for the week ending April 25, 2025.
Economist Views
Click to expand the below image.
Markets will contend with a busy data calendar this week, including government statisticians’ first look at aggregate economic activity and labor market conditions in April. So-called soft data from surveys of consumers and manufacturers should be watched closely. Following shocks, such as the turmoil prompted by recently announced tariff hikes, these indicators often give advance warning of deteriorations in other time series on employment, production, and spending. Fedspeak will be absent, due to the traditional ban on public appearances ahead of the May 6-7 FOMC meeting.
Merchandise Trade Deficit: Expected to narrow to $143bn in March, following the $147.8bn shortfall posted in February. Fears of impending tariffs boosted the gap between goods imports and exports to a record-wide $155.6bn at the beginning of the year.
S&P CoreLogic Case-Shiller (SPCLCS) 20-City Home Price Index: Gains probably slowed in February across the twenty canvassed major metro areas, rising by a comparatively modest .1% after the .5% increase in January. If so, the barometer rose by 4.4% over the latest 12 months, eclipsing by a wide margin the reported 2% rise in consumer prices excluding shelter costs over that span.
JOLTS Job Openings: A reported uptick in online help-wanted postings suggests that nationwide job openings rose by roughly 40K to 7.61mn in March. At an estimated 525K during the reference period, the excess of vacant positions nationwide would represent 1.07 jobs per unemployed person.
Conference Board Consumer Confidence: This gauge likely eroded further during April, tumbling by 11.4 points to 81.5 – the weakest reading since February 2014. Watch the labor differential – the percentage of folks believing that jobs are plentiful less those feeling positions are hard to get – for clues to any change in the unemployment rate in the upcoming Bureau of Labor Statistics’ report.
Real GDP Growth: The BEA’s advance report is expected to show that real GDP expanded at a below-trend SAAR of 1% in Q1, down from the 2.4% clip recorded in Q4. Based on preliminary and incomplete information, the range of estimates is unusually wide, extending from a contraction of 1.5% to a solid 3% gain. Given the likely impact of the tariff-induced surge in the merchandise trade deficit during the reference period, we advise focusing on real final sales to domestic purchasers in this report to gauge the underlying strength of domestic demand.
Personal Income & Spending: Personal income likely rose by .4% in March, following the transfer payment-led .8% jump witnessed in February. Powered by a broadly based surge in goods purchases during the reference period, consumer spending probably climbed by 1% – the largest gain since the beginning of 2023.
Pending Home Sales: Home purchase mortgage applications suggest that contract signings likely climbed by 1.8% to a three-month high in March.
Construction Spending: The nominal value of new construction put-in-place probably remained on a saw-toothed path in March, retreating slightly after the surprising .7% gain witnessed in February.
ISM Manufacturing Activity Index: Available canvasses suggest that the closely followed activity gauge declined to a six-month low of 47.5% in April from 49% in the preceding month.
Employment Situation Report: Job creation probably continued apace at the beginning of Q2. Nonfarm payrolls likely expanded by 150K in April, essentially matching the average gain witnessed over the Q1 span. Weekly soundings on continuing unemployment insurance claims suggest that the unemployment rate dipped to 4.1% during the reference period, placing the Sahm-Rule recession gauge at a 15-month low of .23% below the critical .5%. Average hourly earnings probably rose by .3%, or by 12 cents, to $36.12 per hour, placing the closely followed nominal compensation gauge 3.9% above the $34.75 received by private workers 12 months earlier.
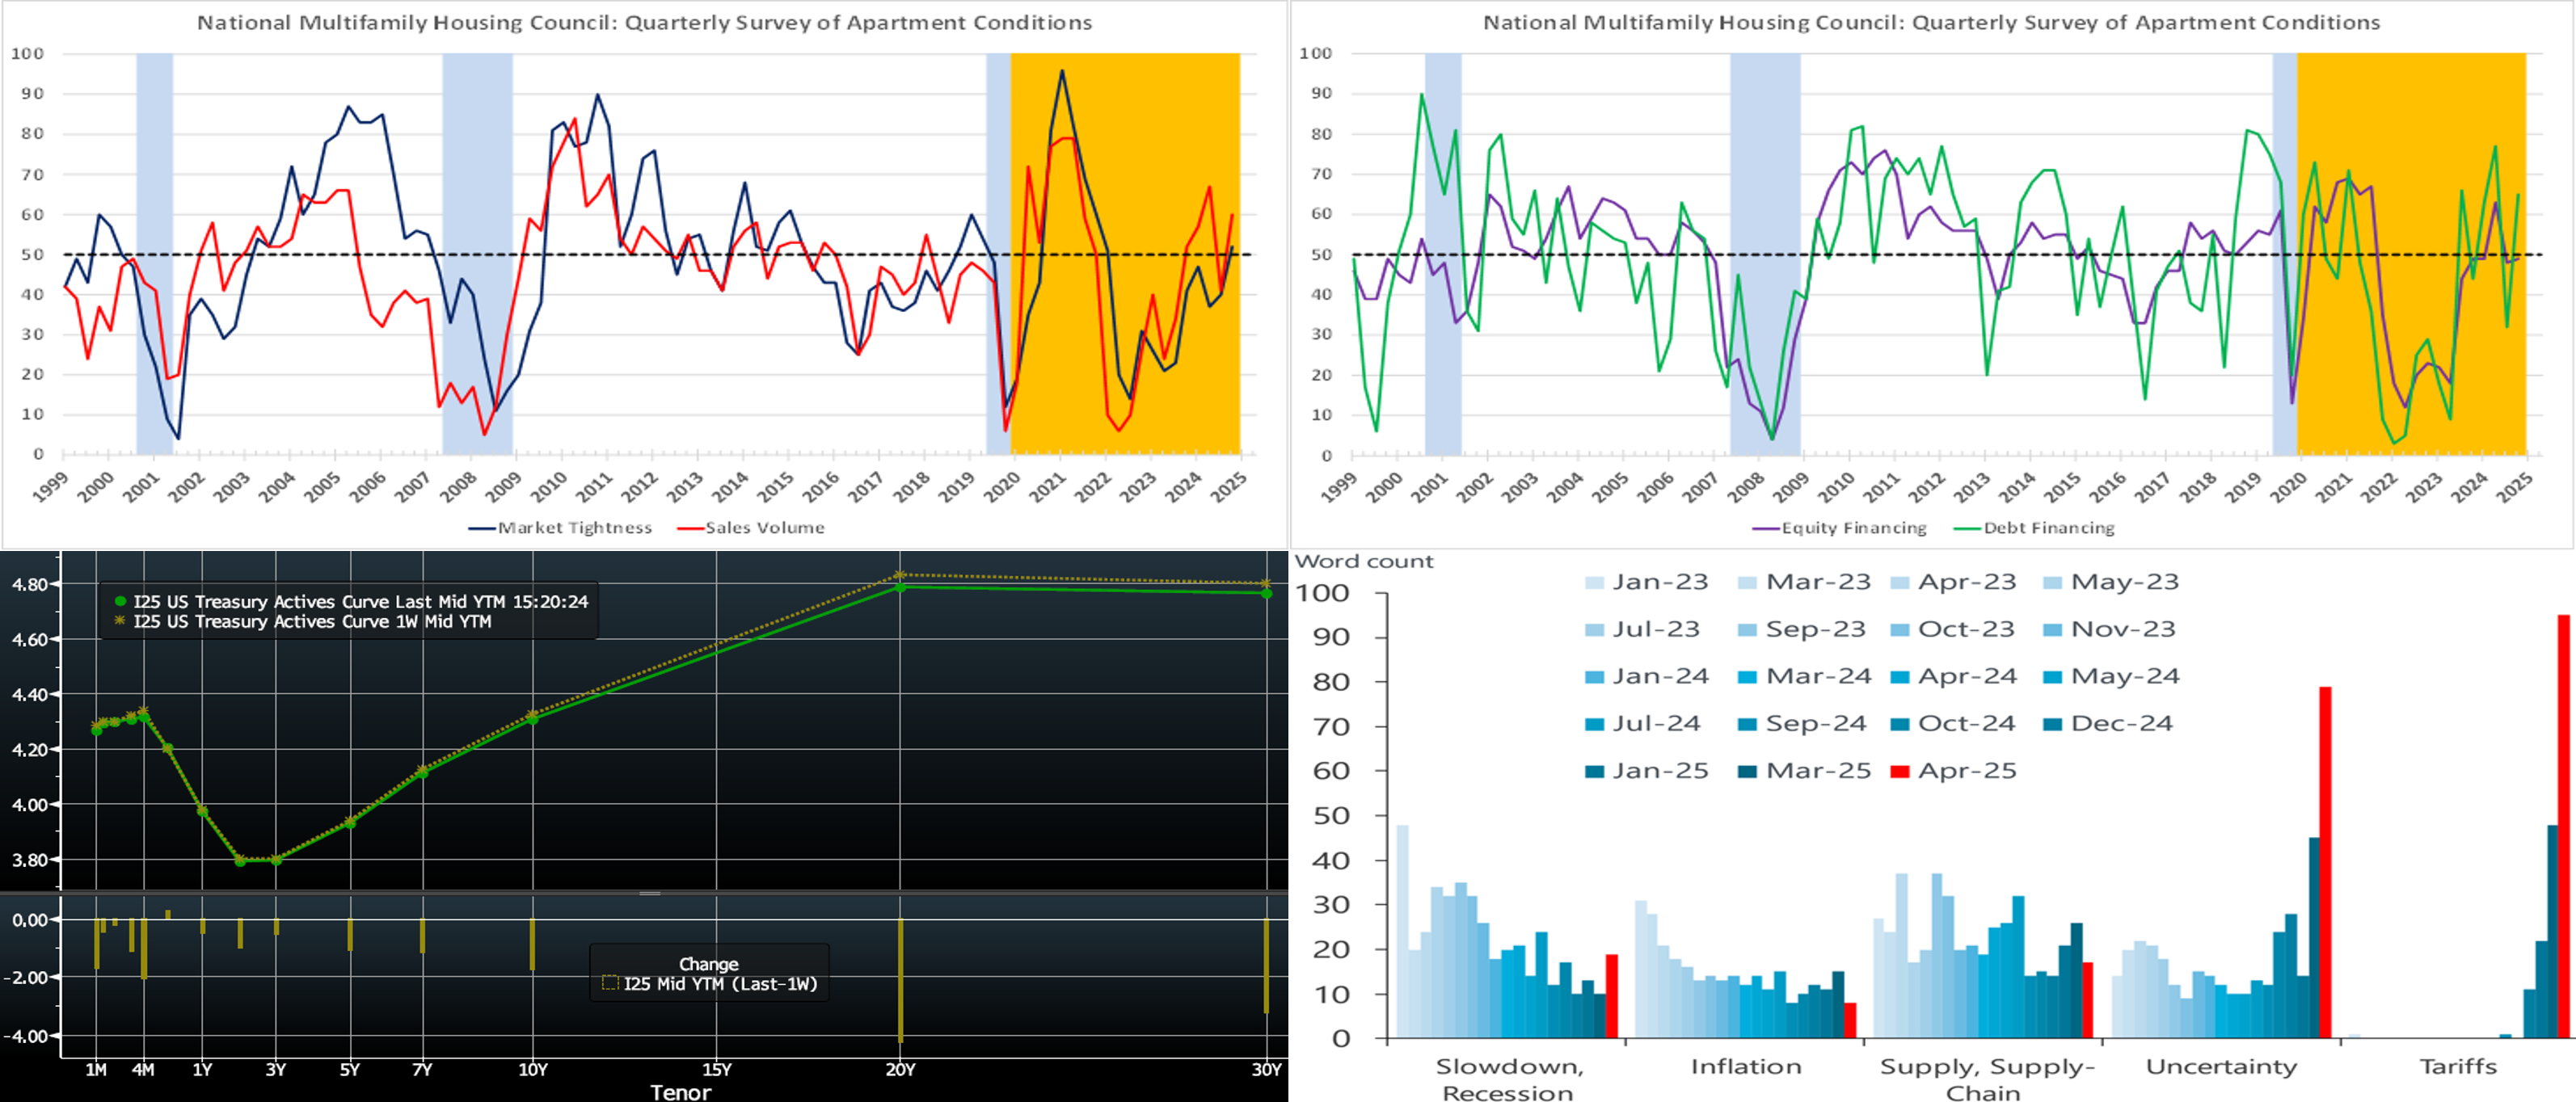
CHART 1 UPPER LEFT and CHART 2 UPPER RIGHT
Source: National Multifamily Housing Council (NMHC); National Bureau of Economic Research; FHLB-NY. Notes: Diffusion indexes are calculated by taking one-half the difference between positive and negative responses and adding 50; blue-shaded areas denote recessions, orange-shaded areas highlight current expansion. Apartment market conditions tightened in the NMHC’s Quarterly Survey of Apartment Market Conditions. The canvass of senior executives at apartment-related firms conducted over the March 31- April 14 span revealed that market tightness, sales volume, and debt-financing readings all registered above the neutral 50-point mark. The NMHC generally views its survey as a snapshot of market sentiment in time. Typically, day-to-day changes that occur over the two-week canvassing period are negligible. But that was not the case this time around, implying that the results should be interpreted cautiously. The changes in U.S. trade policy announced during the survey period impacted global financial markets and spurred a decline in stock prices and rise in long-term yields. According to the NMHC, this volatility had a discernable effect on apartment market sentiment in the latest survey. Specifically, apartment executives who responded to this month’s canvass after the announcement of tariffs on April 2nd—as opposed to the roughly half of respondents who replied over the days prior—were more likely to report worsening conditions for both debt and equity financing, as well as decreasing sales volume compared to the preceding three months. The recent rise in the 10-year UST yield, specifically, appeared to negatively affect assessments of debt financing conditions. Despite these disparities, conditions largely showed improvements compared to three months ago.
CHART 3 LOWER LEFT
Source: Bloomberg. Top pane is yield (LHS, %); bottom pane is change (LHS, bps). At Thursday’s early market close, the UST term curve was modestly changed from the week prior, with the 10-year-and-out sector declining by 2 to 4 bps to lead the limited move. Although the week-on-week move was mild, there were gyrations intraweek; for instance, the 5-year traded in a 3.895% to 4.04% range and was at 3.93% as of this writing. The tariff-induced liquidation in stocks, bonds, and credit has calmed notably, although financial condition metrics remain decidedly tighter than prior to the April 4th “tariff day.” The fact that foreign investors participated at normal levels in the week’s UST auctions also helped to calm the rates markets. Nonetheless, uncertainty looms and markets are on guard. As of Thursday’s close, the market prices end-2025 fed funds at 3.475%, roughly the same as a week ago which equates to ~3.4 25-bps Fed cuts. The market’s end-2026 forward is ~3.10%, or 2 bps lower than a week ago.
CHART 4 LOWER RIGHT
Source: Oxford Economics; Bloomberg. The Fed this past week released its latest Summary of Commentary on Current Economic Conditions by District, more commonly known as the Beige Book. This report is published eight times per year. Each Fed Bank gathers anecdotal information (through April 14th in the latest report) on current economic conditions in its District through reports and interviews with key business contacts, economists, market experts, and other sources. The Beige Book then summarizes this information by District and sector. Shown here is the past few years’ trend in specific economic themes. The latest report, unsurprisingly, is dominated by the themes of uncertainty and tariff policy. Also rising are concerns about a slowdown/recession. These concerns parallel those of other recently released economic sentiment reports. The takeaway here is that these specific concerns are not just a “Wall Street” issue but have circulated through the full “real” economy and consumers and businesses of all sizes. This dynamic is a likely contributor to the less-severe trade talk witnessed over the past week.
FHLBNY Advance Rates Observations
Front-End Rates
- As of Thursday afternoon, short-end rates were generally a bp or two higher vs. a week ago. Earlier in the month, the shortest tenors experienced impacts from lingering tighter overnight repo markets as well as some widening of credit spreads amidst the tariff drama. These pressures continued to cool off this past week, thereby allowing for only mild changes. Robust Money Market Fund AUM levels have helped underpin demand for short-end paper, and funds appear to be gradually returning to the sector post the usual April tax-date withdrawals. Also helpful is that net T-bill supply has been negative in recent weeks, owing to debt ceiling dynamics.
- The market will focus on economic data, particularly Friday’s jobs report, and further trade policy news in the upcoming week.
Term Rates
- The longer-term curve, generally mirroring moves in USTs and swaps, was lower across the curve by 2 to 3 bps vs. the week prior. Kindly refer to the previous section for color on market dynamics and changes. We encourage members to engage with the Member Services Desk for current rate levels and market color.
- On the UST term supply front, the upcoming week serves a reprieve from auctions. Note that UST auctions usually occur at 1pm and can occasionally spur volatility around that time. Please contact the Member Services Desk for further information on market dynamics, rate levels, or products.
Price Incentives for Advances Executed Before Noon: In effect as of Tuesday, September 5, 2023, the FHLBNY is pleased to now offer price incentives for advances executed before Noon each business day. These pricing incentives offer an opportunity to provide economic value to our members, while improving cash and liquidity management for the FHLBNY. For further details, kindly refer to the Bulletin.
Looking for more information on the above topics? We’d love to speak with you!
Archives
Questions?
If you wish to receive the MSD Weekly Market Update in .pdf format (includes FHLBNY rate charts) or to discuss this content further, please email the MSD Team.