Member Services Desk
Weekly Market Update
This MSD Weekly Market Update reflects information for the week ending March 8, 2024.
Economist Views
Click to expand the below image.
Please note that the monthly employment situation report to be released on Friday, March 8th, at 8:30 a.m. may impact markets and any rate levels referred to herein.
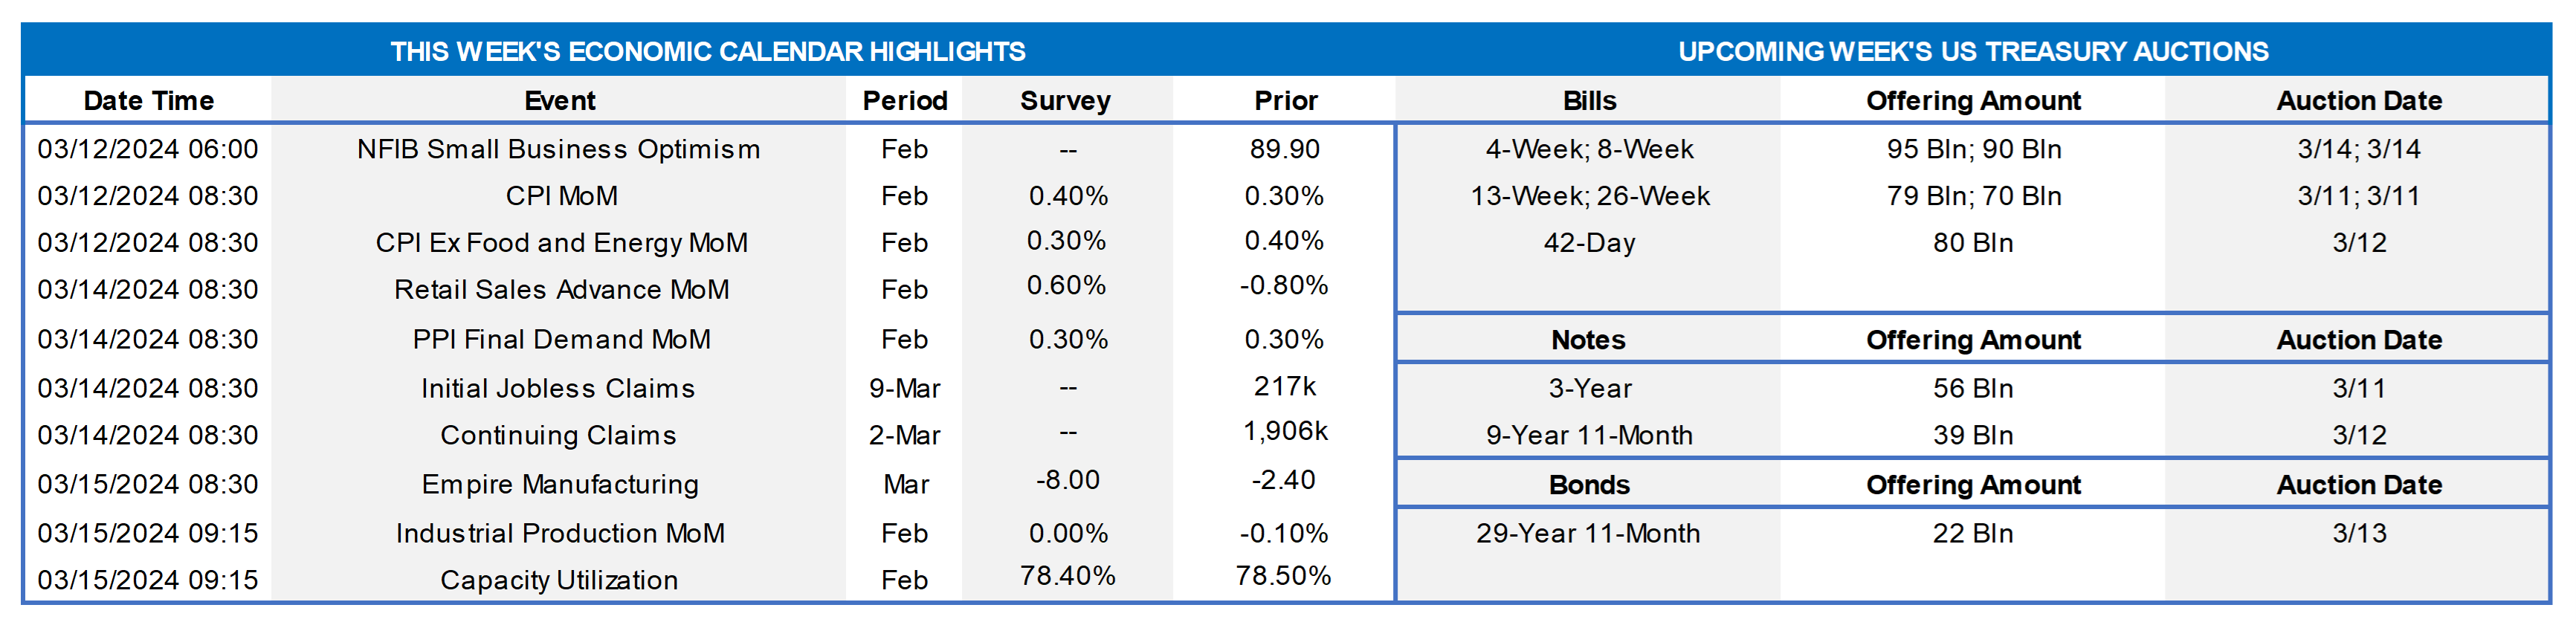
With monetary policymakers observing the traditional blackout period on public appearances ahead of the March 19-20 Federal Open Market Committee meeting, all eyes will be on the economic release calendar. The Bureau of Labor Statistics’ update on consumer goods and services costs in February likely will be the marquee report. The Street is anticipating mixed results, with overall prices quickening but the core consumer price gauge slowing. On a year-over-year basis, the growth rates of both measures are expected to remain well above the Federal Reserve’s desired 2% target. Soundings on retail sales and industrial production will allow economists to update their tracking estimates of real GDP growth during the current quarter. At present, most estimates appear concentrated in a 2-2.5% annualized band, following the solid 3.2% annualized advance witnessed over the final three months of 2023. Other reports are expected to reflect improvement in consumer and small business sentiment in early March, while manufacturing conditions in New York State remained challenging.
NFIB Small Business Optimism Index: The gauge likely climbed to 90.8 in February from 89.9 in January, matching the average reading posted over the prior three months.
Consumer Prices: Rebounding gasoline pump prices probably pushed the Consumer Price Index (CPI) .4% higher in February, after a larger-than-expected .3% rise in the prior month. Capped by anticipated reductions in motor vehicle costs during the reference period, the so-called core CPI excluding volatile food and energy components likely climbed by .3%, following a .4% hike in January. Those projections, if realized, would place the overall and core CPIs 3.1% and 3.7% above their respective year-ago levels – both still well above Federal Reserve’s desired 2% target.
Jobless Claims: Initial claims for unemployment insurance benefits probably remained range-bound between 200-220K during the filing period ended March 9. Continuing claims – the total number of persons collecting jobless benefits – probably registered below the 1.9mn mark during the week ended February 24, reversing a portion of the prior period’s 45K rise.
Retail & Food Services Sales: Buoyed by a favorable swing in weather conditions, sales likely jumped by 1% in February, erasing the .8% drop witnessed in January and marking the largest one-month gain since that of 3.8% at the beginning of 2023. Excluding an anticipated 1.9% rise in auto-dealer revenues, retail purchases are expected to have climbed .8% higher during the reference period, after a .6% decline in January. As always, pay attention to so-called “control” sales excluding auto, building materials, and gas purchases for clues to the pace of current-quarter consumer spending. Barring any prior-month revisions, a .8% rise would leave core purchases over the January-February span 1.7% annualized above their October-December average, after Q4’s 3.4% annualized gain.
Empire State Manufacturing Survey: Manufacturing activity in New York State likely contracted for a third straight month in March, with the net percentage of respondents witnessing a pickup in business less those experiencing a decline worsening from the -2.4% posted in February.
Industrial Production & Capacity Utilization: A tug of war between rebounding factory output and a weather-related drop in utilities generation probably pushed industrial production .2% higher in February, erasing January’s .1% dip. With output expected to match additions to productive capacity during the reference period, the capacity utilization rate likely held steady at 78.5%.
Michigan Sentiment Index: Consumers’ appraisals of current and prospective economic conditions probably improved over the early part of March, lifting the University of Michigan’s confidence barometer to a 2½-year high of 79.5 from 76.9 in February.
Federal Reserve Appearances: None. Federal Reserve officials will observe the blackout period ahead of the March 19-20 FOMC meeting.
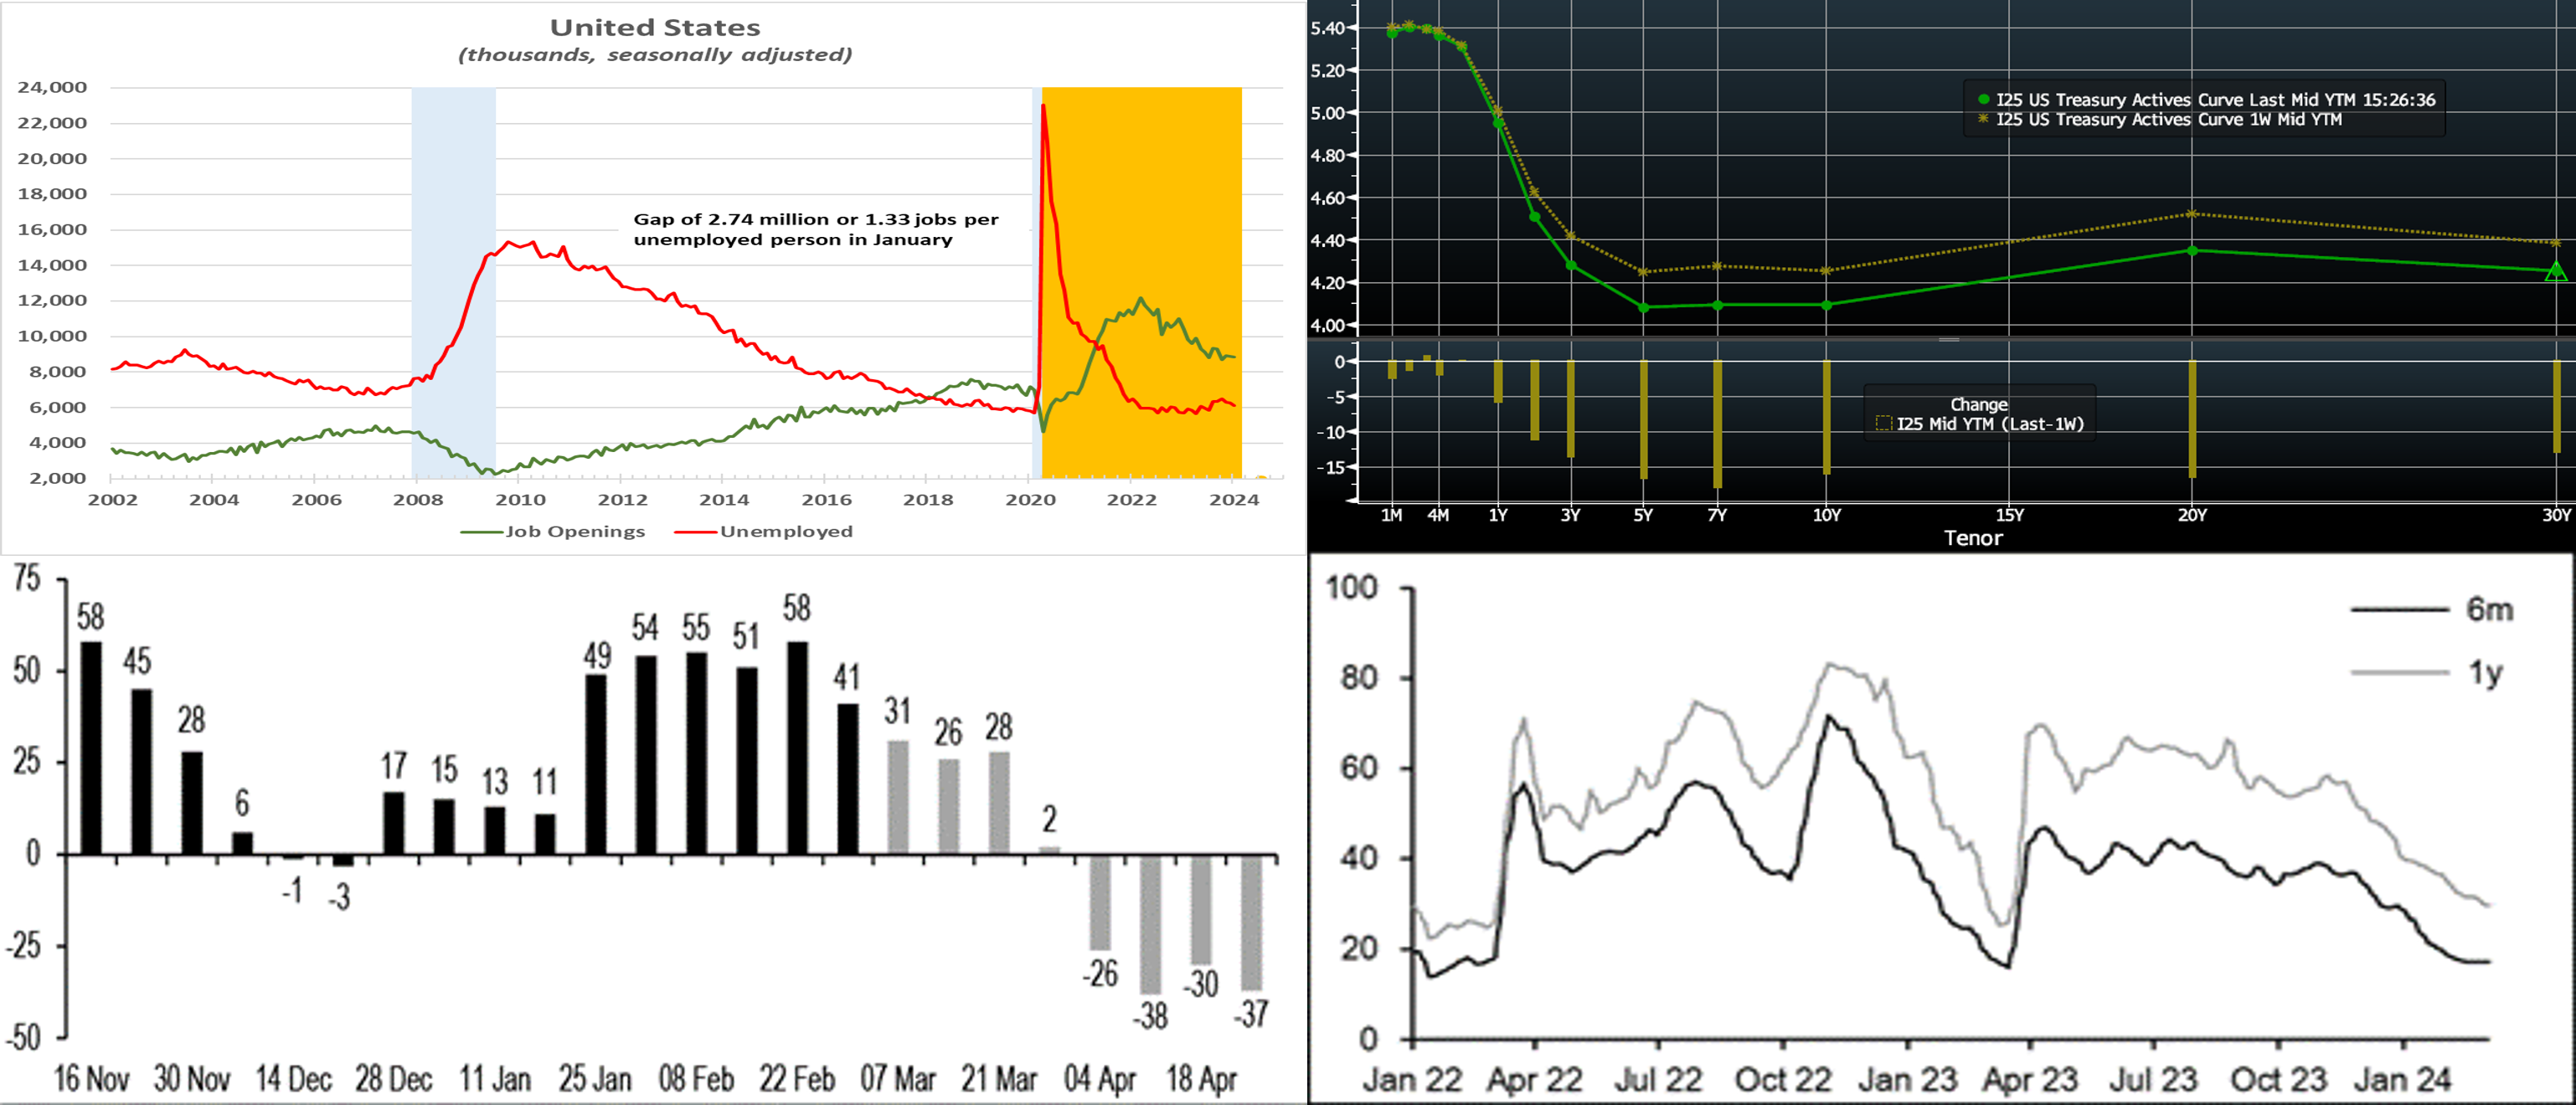
CHART 1 UPPER LEFT
Source: Bureau of Labor Statistics; National Bureau of Economic Research; FHLB-NY. Notes: Light blue shaded areas denote recession; Orange shaded area denotes current expansion. According to the BLS’ latest Job Openings and Labor Turnover (“JOLT”) Survey, job openings dipped by 26K to a three-month low of 8.86mn in January, matching the median market projection. Despite the reported beginning-of-the-year pullback, there remain almost 2.74mn more open positions than unemployed persons nationwide, or 1.33 jobs per unemployed person. With labor demand continuing to eclipse available supply by a significant margin, additional solid wage gains likely are in store over the course of 2024. This dynamic has contributed to the Fed’s recent mantra of not being in a rush to cut rates. On the flip side, the report also showed a decline in job quits rate, thereby reflecting some moderation in job markets and limited risk of the Fed considering another hike.
CHART 2 UPPER RIGHT
Source: Bloomberg. Top pane is yield (LHS, %), bottom pane is change (LHS, bps). From last Thursday afternoon to this one, the UST curve moved lower, led by the 5- to 7-year sector which was down by ~18 to 20 bps. Fed members continued to express a theme of not rushing towards rate cuts but that a few cuts are likely in store this year if conditions unfold as anticipated; indeed, Chair Powell expressed this sentiment at his Congressional appearance this past week. Meanwhile, moderate-toned Fedspeak and economic data, along with an absence of UST auctions, helped to revive UST demand. In terms of market-implied pricing of the Fed, a full 100% probability of a 25 bp cut is still August 1st, with the June 13th FOMC priced at ~91% chance, up from 73% last week. The year-end 2024 forward is ~4.42%, roughly 9 bps lower than last week. Therefore, the market prices for a cumulative total of ~91 bps of cuts by the end of 2024, about 9 bps more than a week ago.
CHART 3 LOWER LEFT
Source: JP Morgan. Shown here is a snapshot, historical and also forward-looking projections, of weekly net issuance (LHS, $bn) of T-bills. While it has been net positive the last few months, net supply is expected to decelerate in the next few weeks and turn negative in April. This forecast is in line with historical and seasonal tendencies, namely that T-bill issuance ramps up in February and March to fund tax refund payments, while receipts subsequently surge in April and June 15th around the individual income tax and the quarterly estimated tax deadlines. Current conditions suggest that these dynamics could be amplified this year, given the unemployment rate being near/at a historical low, along with strong investment asset performance in 2023, which should spur strong income and capital gains tax receipts. T-bill valuations tend to be relatively inelastic and not impacted greatly by supply dynamics, but the upcoming decline in supply may lend marginal impetus to richer levels. In turn, this may lead to more attractive Advance levels.
CHART 4 LOWER RIGHT
Source: JP Morgan. Shown here are floating rate note credit spreads (LHS, bps) for 6-month and 1-year bank-issued CP/CD paper. Conditions in this market continue to be favorable, as evident by the tightening in credit spreads thus far in 2024. Many banks will surely assess funding options over the next few months, especially given that BTFP loan maturities are expected to begin in earnest over coming weeks and ramp up thereafter. Notably, our Advance levels compare favorably here, especially on an “all-in” basis including the dividend. To learn more about “all-in” advance rates, please contact the Member Services Desk and obtain a copy of our “All-in Borrowing Tool”.
FHLBNY Advance Rates Observations
Front-End Rates
- Short-end rates were 1 to 3 bps lower week-over-week, with the 5 and 6-month tenors leading the modest decline. Net T-bill supply, after a long spell in positive territory, is now expected to decrease and eventually turn negative next month. This development, all else equal, may help tighten spreads on FHLB paper. Moreover, short-end supply continues to be absorbed well, as Money Market Funds (MMFs) currently stand at or near all-time high AUM levels.
- With the Fed in blackout mode, the market will monitor economic data; the CPI release will likely be the headline event of the upcoming week.
Term Rates
- The longer-term curve, generally mirroring moves in USTs and swaps and led by the 5-year, was up to 20 bps lower week-on-week. Please refer to the previous section for color.
- On the UST term supply front, the upcoming week serves 3/10/30-year auctions. Corporate bond supply, meanwhile, has been at record levels and may remain heady. Note that UST auctions usually occur at 1pm and can occasionally cause volatility around that time. Please contact the Member Services Desk for further information on market dynamics, rate levels, or products.
Grant funding under the FHLBNY 2023 Small Business Recovery Grant (SBRG) Program has begun and some funds are still available. The SBRG Program provides grant funds to benefit FHLB-NY members’ small business and non-profit customers. Please visit the SBRG webpage.
Price Incentives for Advances Executed Before Noon: In effect as of Tuesday, September 5, 2023, the FHLBNY is pleased to now offer price incentives for advances executed before Noon each business day. These pricing incentives offer an opportunity to provide economic value to our members, while improving cash and liquidity management for the FHLBNY. For further details, kindly refer to the Bulletin.
The Symmetrical Prepayment Advance Feature
For those anticipating term funding needs, and with rates on an uptrend, it can be an appropriate juncture to consider our SPA feature. This feature allows the member to capture, at prepayment, changes in the fair value of the advance which are favorable to the member. Contact Member Services Desk to discuss.
Looking for more information on the above topics? We’d love to speak with you!
Questions?
If you wish to receive the MSD Weekly Market Update in .pdf format (includes FHLBNY rate charts) or to discuss this content further, please email the MSD Team.