Member Services Desk
Weekly Market Update
This MSD Weekly Market Update reflects information for the week ending October 6, 2023.
Economist Views
Click to expand the below image.
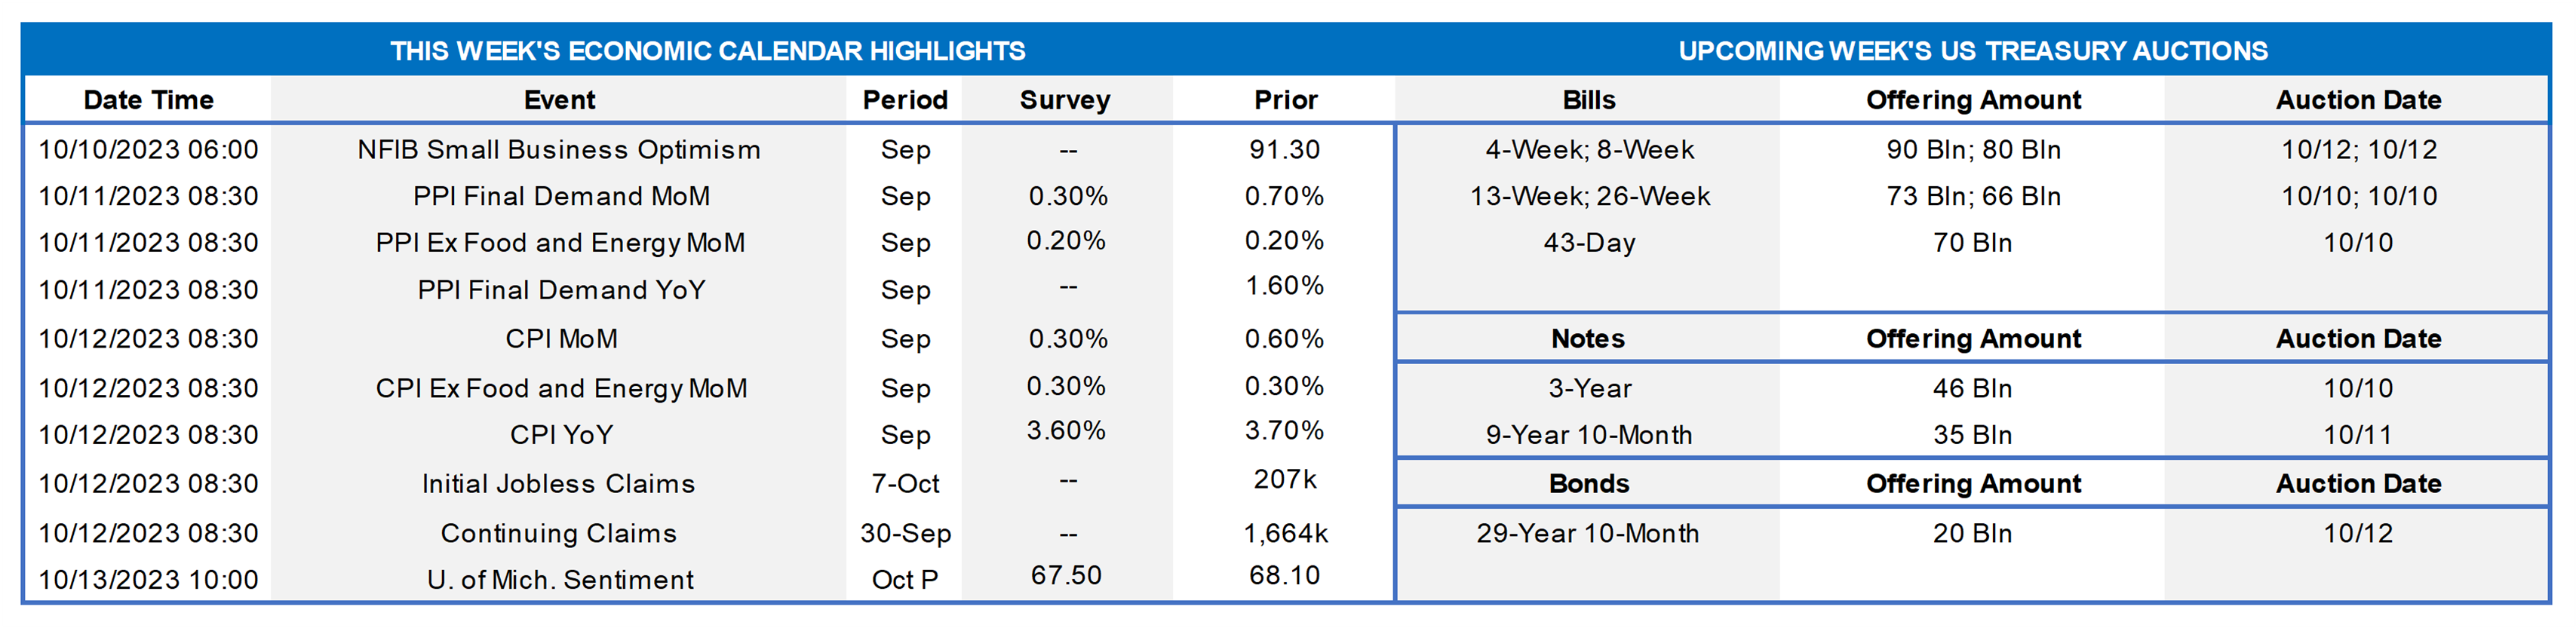
Please note that the Friday, October 6th, 8:30 a.m. employment figures may serve to notably move markets and rate levels cited herein.
Having weathered the Bureau of Labor Statistics’ update on the employment situation in September, the market’s focus will turn to the inflation side of the Federal Reserve dual mandate. Owing to subdued energy prices and smaller shelter cost increases, the year-to-year growth rates of key consumer inflation gauges likely slowed last month yet remained well above policymakers’ desired 2% target. The Fed speech calendar will be crowded this week, with seven FOMC voters slated to give their views on the US economic and monetary policy outlook. With the issue of an updated Summary of Economic Projections in hand, traders and investors likely will pay less attention to the minutes of the September 19-20 FOMC meeting than they did to those following the late-July meeting.
NFIB Small Business Optimism Index: Canvasses of larger firms suggest that this sentiment improved marginally to 91.7 in September from 91.3 in August.
Producer Price Index for Final Demand: A moderation in wholesale energy costs is expected to have limited the September rise in the PPI for final demand at .3% last month, after a .7% hike in August. If realized, that estimate would leave the year-to-year rise in the PPI unchanged at 1.6%.
Consumer Price Index: Capped by smaller increases in airfares, shelter costs, and gas prices, the headline CPI likely edged .2% higher in September, after a .6% jump in August. Excluding volatile food and energy components, core CPI probably climbed by .2% as well, following a .3% prior-month gain. Those projections, if realized, would place the headline and core CPIs 3.5% and 4% above their respective year-ago levels.
Jobless Claims: Furloughs of workers in the strike-impacted automotive industry may push claims above the nearly half-century lows witnessed over the previous three weeks.
University of Michigan Sentiment Index: Consumers’ appraisals of current and prospective economic conditions likely rebounded in early October, lifting the barometer to 69.3 from 68.1 in September.
Federal Reserve Appearances:
- Oct. 9 Federal Reserve Vice Chair Michael Barr to speak at the American Bankers Association annual convention.
- Oct. 9 Dallas Fed President Lorie Logan to speak about the US outlook and monetary policy at the NABE annual meeting.
- Oct. 9 Federal Reserve Governor Philip Jefferson to give talk – “A View from the Federal Reserve Board” at NABE meeting.
- Oct. 10 Atlanta Fed President Bostic to take part in a conversation about the economy at the ABA Annual Convention.
- Oct. 10 Fed Governor Waller to deliver keynote address at a monetary policy conference hosted by George Mason Univ.
- Oct. 10 San Francisco Fed President Daly to discuss economic challenges faced by young Americans in Chicago.
- Oct. 11 Atlanta Fed President Bostic to speak about economic conditions at the Metro Atlanta Chambers ATLeaders lunch.
- Oct. 11 Minute from September 19-20 Federal Open Market Committee meeting to be released.
- Oct. 12 Atlanta Fed President Bostic to deliver welcoming remark at the National Agriculture Conference at the Atlanta Fed.
- Oct. 13 Philadelphia Fed President Harker to speak about the outlook with the Delaware State Chamber of Commerce.
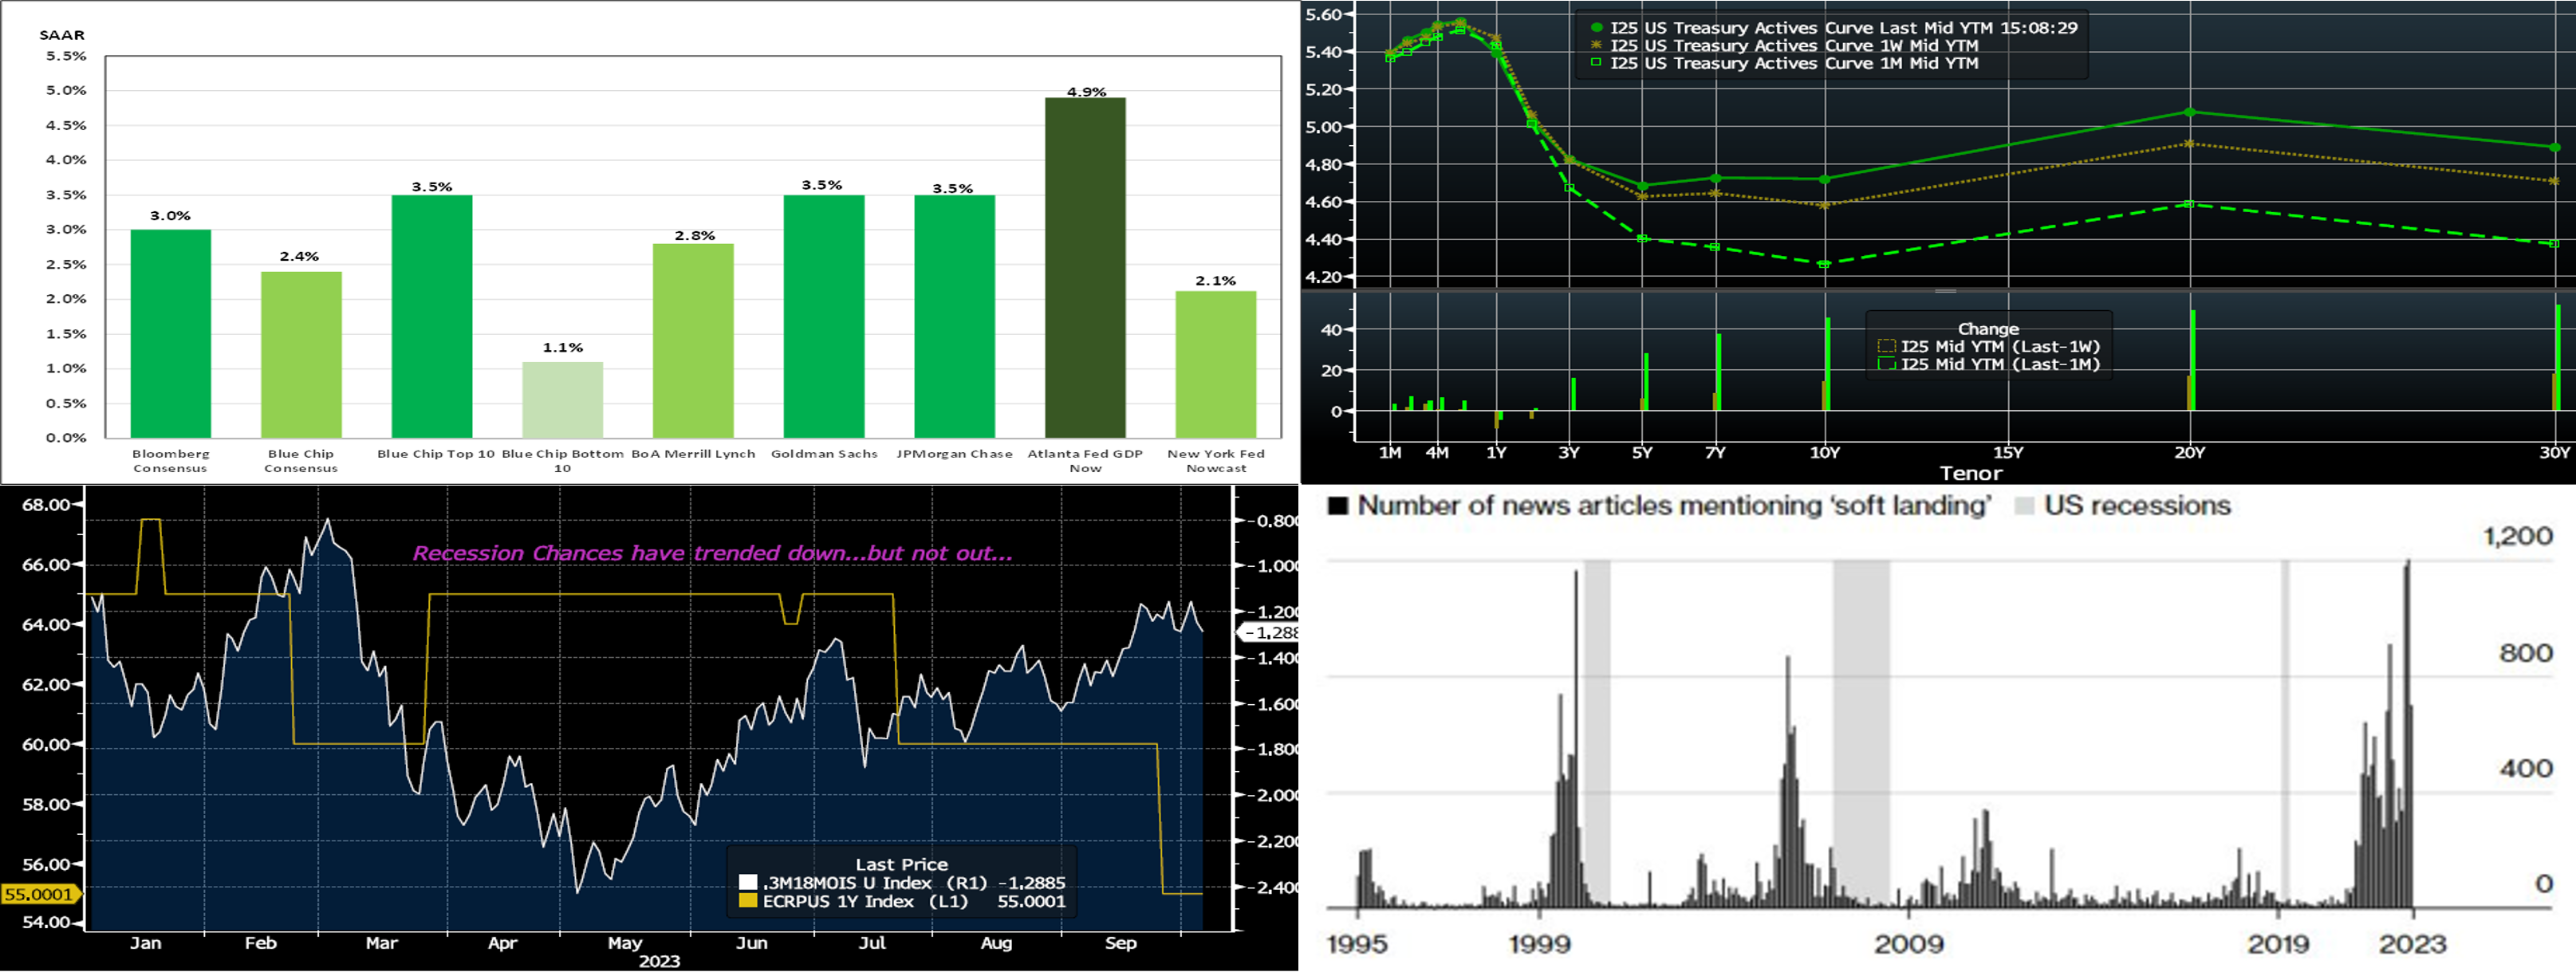
Source: Bloomberg; Blue Chip Financial Forecasts; Federal Reserve Banks of Atlanta and New York; FHLB-NY. Responding to an almost uninterrupted string of positive economic data surprises, economists have been boosting their estimates for the Bureau of Economic Analysis’ (BEA) advance report on Q3 real GDP growth to be released on October 26. While the range of projections remains admittedly wide, the median Street projection currently stands at 3% annualized, up one full percentage point from two weeks ago. Notably, the Federal Reserve Bank of Atlanta’s GDPNow tracking estimate, which accurately called the BEA’s initial growth estimates for both Q1 and Q2, calls for a marked acceleration during the summer quarter to 4.9% from 2.1% in Q2, more than double the long-run expected average and the strongest performance since the fall of 2021.
CHART 2 UPPER RIGHT
Source: Bloomberg. Top pane is yield (LHS, %), bottom pane is change (LHS, bps). From last Thursday afternoon to this one, the UST curve continued its recent bear steepening trend, although moderating notably from mid-week levels. While the shorter tenors were barely changed, the 10-year and longer sector was up 12 to 18 bps. Early Wednesday, however, yields were ~10 to 15 bps higher than as of this writing and reached levels not seen since ’06-’07. The Fed’s higher-for-longer mantra, global yields trading higher, and supply/demand dynamics all contributed to the move. Higher UST supply amidst a Fed that is running down its securities portfolio continue to pose a challenging technical backdrop and leading to higher term premiums out the curve. In terms of market-implied pricing of the Fed, the 2023 peak Funds rate in December now stands at ~5.425%; essentially, the market is pricing a bit below the Fed’s dot plot with only ~39% chance of another 25 bp hike this year. The years 2024 and 2025 dipped a tad from a week ago, with the year-end 2024 forward ~4 bps lower, at 4.56%.
CHART 3 LOWER LEFT
Source: Bloomberg. With GDP estimates rising, recession probabilities have edged lower. The Bloomberg U.S. Recession Probability Forecast Indicator (Gold, LHS, %, derived from their surveys) measures the median forecasted probability of recession in the year ahead; it has clearly taken a few legs lower since spring. Also shown here is the yield curve spread of spot 3-month versus 3-month 18-month forward (White, RHS, %), an indicator dubbed in Fed research as the “Near-term Forward Spread”. We show Overnight Index swaps here, instead of USTs, owing to ease of use and charting. This spread has been cited in past Fed research, and even by Chair Powell himself, as a preferred and more optimal predictive indicator of potential recessionary periods ahead. Basically, the more inverted it is, the greater chance of potential recession, as the market is pricing for Fed cuts in forward space. This spread has oscillated widely this year, but it has steepened since spring and so also thereby signals less recessionary threat. However, the spread is still inverted, with the market pricing ~125 bps of cumulative Fed cuts by 18 months’ time and pricing below the Fed’s dot plot in that timeframe.
CHART 4 LOWER RIGHT
Source: Bloomberg and data compiled from Bloomberg-tracked news sources. While odds of recession have ebbed and chances of a “soft landing” increased, here is some anecdotal evidence supporting the need to always manage for any outcome! Optimism, reflected here in the form of increased volume of “soft landing” news pieces, has sometimes peaked just prior to an economic downturn. Economic forecasting is inherently difficult, often reflecting that what occurs next will be an extension of what has already happened or, in other words, a linear process. But recessionary outcomes are often non-linear events; for instance, in the current situation, lagged impacts of Fed tightening might take a sudden and sharp toll on consumers and companies. While the economic path remains to be seen, this uncertainty and potential threat is a main reason the market still prices for Fed rate cuts in 2024.
FHLBNY Advance Rates Observations
Front-End Rates
- Short-end rates were mostly unchanged to a bp lower week-over-week. Net T-bill supply remains positive, given announcements from the Treasury regarding upsized auctions and issuance needs. But the supply continues to be absorbed well, as Money Market Funds (MMFs) switch from the Fed’s RRP to T-bills with competitive yields. Moreover, FHLB supply has subsided from peak levels of spring, further assisting T-bill interest from investors and thereby containing any severe upward pressure on rates from T-bill supply. MMFs currently stand at or near all-time high AUM levels.
- The upcoming week’s data and Fedspeak should drive direction near-term.
Term Rates
- The longer-term curve, generally mirroring the moves in USTs and swaps, was steeper week-over-week. While shorter tenors dipped a few bps, the 5-year-and-out was up to 8 bps higher in steepening fashion. We continue to experience keen demand for putable advances, albeit less so with this week’s moves. Kindly refer to the previous section for relevant market color. Please call the Member Services Desk to learn more.
- On the UST term supply front, the upcoming week serves 3/10/3-year auctions. Note that UST auctions usually occur at 1pm and can cause volatility around that time. Please contact the Member Services Desk for further information on market dynamics, rate levels, or products.
Price Incentives for Advances Executed Before Noon – In effect as of Tuesday, September 5, 2023 – The FHLB-NY is pleased to now offer price incentives for advances executed before Noon each business day. These pricing incentives offer an opportunity to provide economic value to our Members, while improving cash and liquidity management for the FHLBNY. For further details, kindly refer to the bulletin.
Forward Start Advance (FSA): For members with upcoming borrowing or refunding plans, consider the FSA as a method to opportunistically “lock in” rates before advance settlement date. Please contact the Member Services Desk at (212) 441-6600 for more information.
The Symmetrical Prepayment Advance Feature
For those anticipating term funding needs, and with rates on an uptrend, it can be an appropriate juncture to consider our SPA feature. This feature allows the member to capture, at prepayment, changes in the fair value of the advance which are favorable to the member. Contact Member Services Desk to discuss.
Looking for more information on the above topics? We’d love to speak with you!
Questions?
If you wish to receive the MSD Weekly Market Update in .pdf format (includes FHLBNY rate charts) or to discuss this content further, please email the MSD Team.