Member Services Desk
Weekly Market Update
This MSD Weekly Market Update reflects information for the week ending June 2, 2023.
Economist Views
Click to expand the below image.
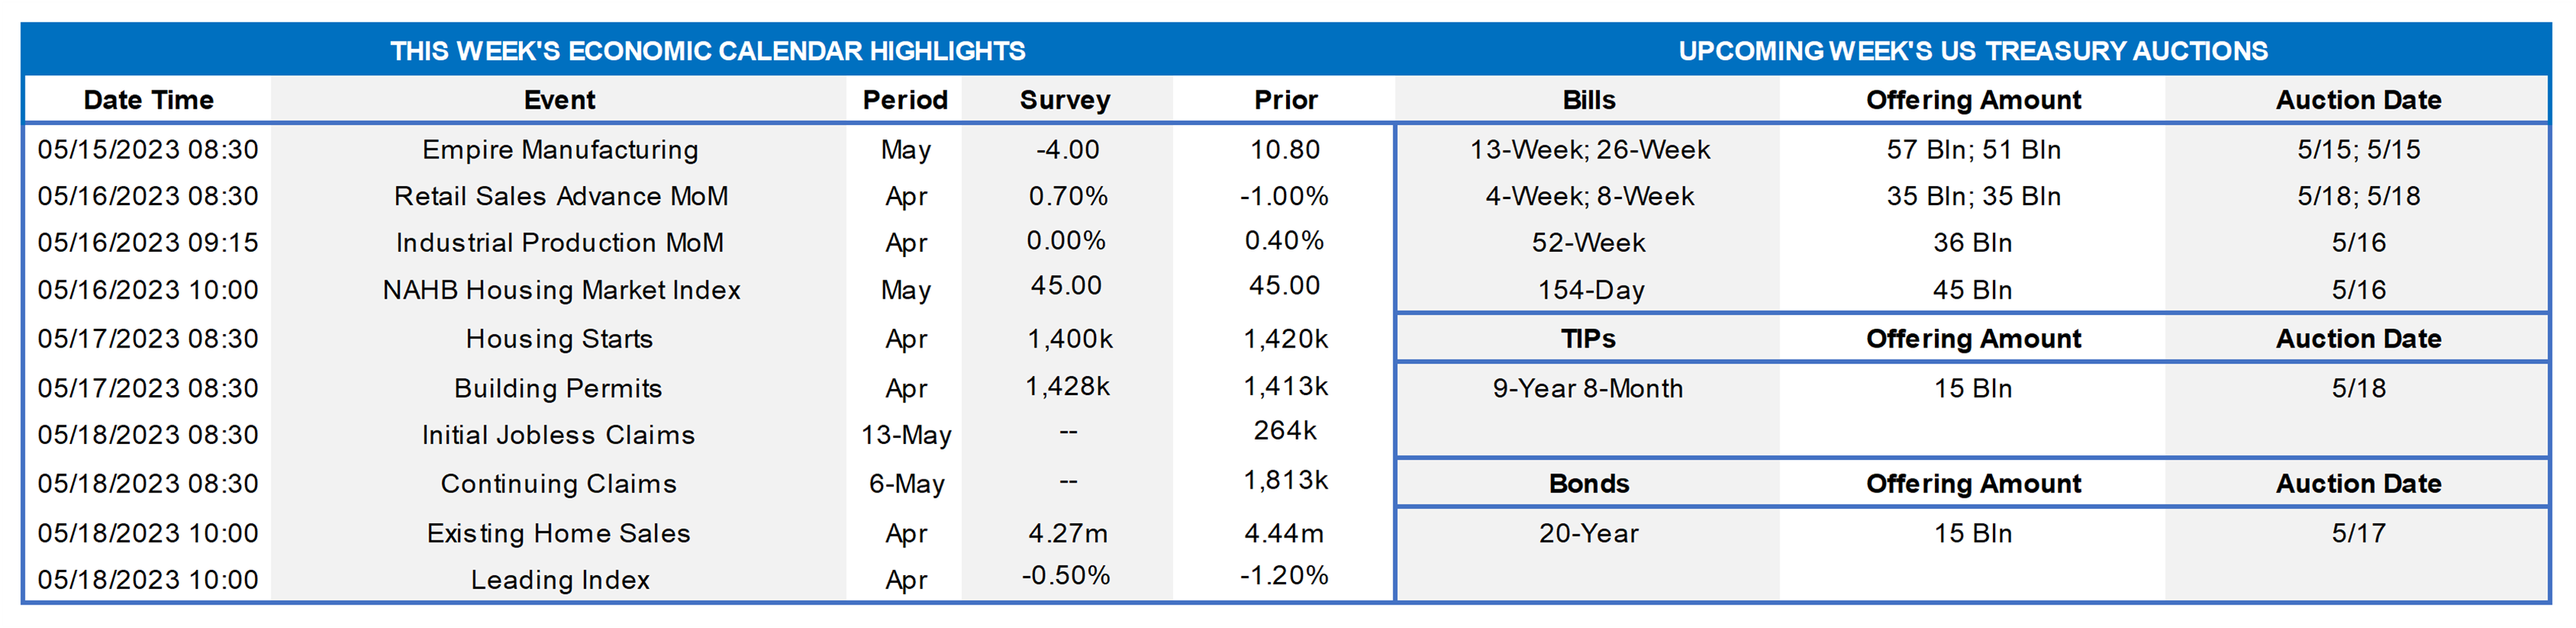
With a debt-limit deal nearing completion and monetary policymakers observing the traditional blackout period on public appearances ahead of the June 13-14 Federal Open Market Committee meeting, the attention of market participants will return to the economic release calendar. Unfortunately for those seeking data-driven excitement, statistical mills will be serving exceptionally thin gruel this week. Indeed, the Institute for Supply Management’s canvas of service-providing firms may well be the marquee release. The median Street forecast calls for a slowdown in real GDP growth during the current quarter to 0.6% annualized from the 1.3% pace set during the winter quarter, but some closely watched estimates are tracking closer to a near-trend 2% clip. Updates on factory orders and international trade activity in April may prompt minor tweaks to those projections.
Factory Orders: A transportation equipment-led rise in durable goods requisitions, combined with an anticipated rebound in nondurables bookings, probably propelled factory orders .9% higher in April, after an upwardly revised .7% gain in March.
ISM Services Index: Available surveys suggest that service-producing activity quickened in May, lifting the Institute for Supply Management’s gauge to a three-month high of 53% from 51.9% in April.
International Trade Balance: Reflecting a sharp widening of the merchandise trade gap, the deficit on international trade in goods and services likely swelled to a six-month high of $77.2bn in April from the $64.2bn shortfall recorded in March.
Consumer Credit: Consumer installment credit is expected to have remained on a saw-toothed path in April, expanding by $21.2bn following a $26.5bn takedown in March.
Jobless Claims: Initial claims for unemployment benefits likely remained within their recent 225-250K range during the filing period ended June 3. Keep an eye on continuing claims for signs that furloughed employees may be having a tougher time finding work.
Federal Reserve Appearances: None. Federal Reserve officials observing blackout period ahead of the June 13-14 FOMC meeting.
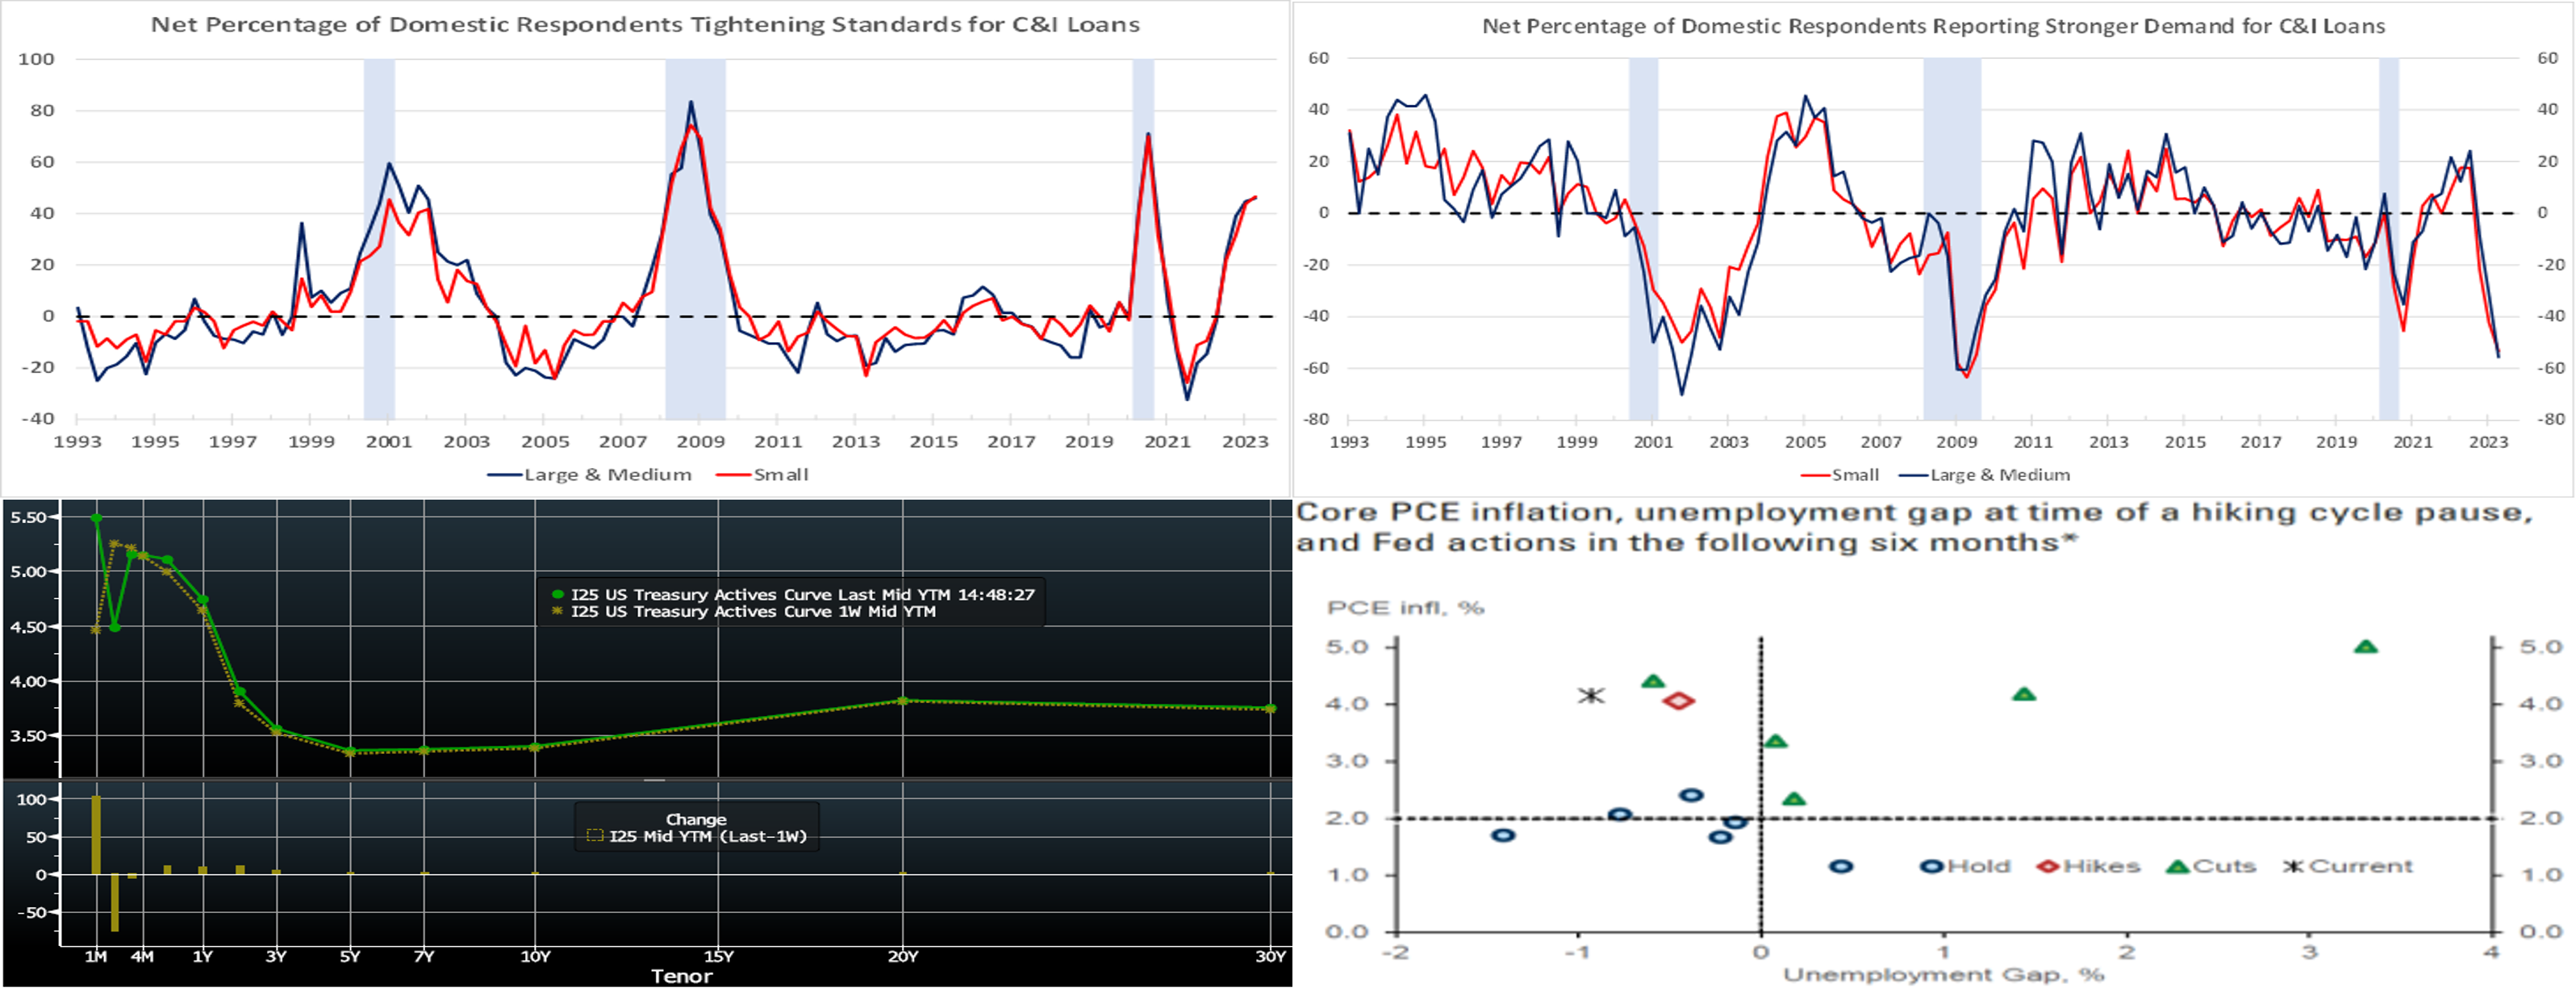
CHART 1 UPPER LEFT
Source: Federal Housing Finance Agency; National Bureau of Economic Research; FHLB-NY. Note: Blue-shaded areas denote recessions, orange-shaded current expansion. Home prices moved higher across most of the FHLB-NY district during the winter quarter, with New York State and New Jersey witnessing .3% and 1.8% respective gains. Statewide figures masked significantly different performances across major statistical areas over the first three months of the year, however. Indeed, selling prices climbed by 3.9% in Syracuse over the January-March span, extending a string of quarterly gains going back to the summer of 2020, while those in the New York-Jersey City-White Plains MSA (metro statistical area) declined by .7%, erasing the rise recorded in the final quarter of 2022. Over the past three years, Camden, Syracuse, and Rochester have experienced the largest annualized home price increases of 14.7%, 13.2% and 12.6%, respectively.
CHART 2 UPPER RIGHT
Source: Bloomberg. Top pane is yield (LHS, %), bottom pane is change (bps). From our last edition two Thursday afternoons ago to now, UST term yields performed a roundtrip, as they declined in the past week after rising the week prior. From two weeks ago, the 1 to 5-year zone finished higher and flatter by ~2 to 6 bps, while yields were a few bps lower further out the curve. Progress on the debt ceiling and some dovish Fedspeak this past week inspired some of the move. As of this Thursday afternoon’s writing, the market prices the odds of a 25 bps hike at the June 14th FOMC at ~30%. Conversely, the market is pricing in close to 58% probability of a 25 bps cut for the November 1 FOMC. The year-end Fed Funds forward is ~4.85%, ~22 bps higher than two weeks ago. All are subject to change, especially given the color below plus tomorrow’s employment report. Please call the desk for further information on market dynamics and/or products.
CHART 3 LOWER LEFT
Source: Bloomberg; FHLB-NY. Shown here is the market-implied probability (LHS, %, derived from Fed Funds futures and swaps), over the past month, of another 25 bps hike at the upcoming June 14th FOMC. In colloquial terms, it has been “all over the place.” After the last FOMC at the beginning of May, there was a slight chance of an ease priced into this curve point! And then last week, there was a ~70% chance of a hike. As of this writing Thursday afternoon, the probability of a hike has dipped to ~30%. Much of the latest dip in rate hike probability was a result of dovish comments from a few Fed members who expressed implicit and/or outright support for a pause at the upcoming meeting. Tomorrow morning’s jobs report may shift these probabilities again and so warrants an eye.
CHART 4 LOWER RIGHT
Source: FDIC; Company Data; Goldman Sachs Research. Shown here is historical perspective, during Fed hiking cycles, on deposit betas in relation to both the absolute level and the start and end levels of the Fed Funds rate. The current cycle, as seen in the dashed-box area, has been a historically steep one, as Fed Funds have risen from .125% to now 5.08% and potentially will approach ~5.40% if the Fed hikes again. Based on past behavior, the cumulative deposit beta in the current cycle certainly appears at risk of rising further. Continued inflows to Money Market Funds, more advanced banking technology and information than in past cycles, and an expected surge in net T-bill issuance (possibly pressuring rates higher, all else equal) post-debt ceiling deal will all likely exacerbate the pressure on deposit betas.
FHLBNY Advance Rates Observations
Front-End Rates
- Short-end rates are higher by 20 to 30 bps from two weeks ago. Maturities now cross closer or further into the timeline of another potential, albeit uncertain, Fed rate hike. Also, the debt ceiling dynamic pressured T-bill yields higher which, in turn, has dragged ours and other short-end rates higher too. Strong investor demand in the very short-end sector, much of it driven by increasing money market fund (MMF) AUM inflows, remains in place but has moderated somewhat from a month ago. Please see the previous section for color on Fed pricing.
- With the Fed in blackout mode before the June 14th FOMC outcome, economic data should dictate rates direction.
Term Rates
- The longer-term curve also roundtripped over the past two weeks, generally mirroring moves in USTs and swaps. But it is now higher and flatter than two weeks ago, with 1 and 2-year up by ~18 and 10 bps, respectively, while 3-year is ~5 bps higher, 5-year ~3 bps higher, and longer tenors generally unchanged to a few bps lower. Kindly refer to the previous section for relevant market color. The advance curve remains inverted out to 5-year, thereby offering opportunities to extend in advance duration at lower coupon cost. Indeed, we have seen strong member interest in this area.
- On the UST term supply front, this upcoming week serves as a reprieve from auctions. Please contact the Member Services Desk for further information on market dynamics, rate levels, or products.
Product Alert: FHLBNY is pleased to announce the reintroduction, after a temporary suspension owing to Libor-cessation, of the Putable Advance, Fixed-Rate with SOFR Cap Advance, and ARC with SOFR Cap/Floor Advance. The Callable Advance continues to be offered. This expansion of the product menu will provide members with more options and flexibility for the management of funding and/or hedging needs.
Forward Start Advance (FSA): For members with upcoming borrowing or refunding plans, consider the FSA as a method to opportunistically “lock in” rates before advance settlement date. Please contact the Member Services Desk at (212) 441-6600 for more information.
The Symmetrical Prepayment Advance Feature
For those anticipating term funding needs, and with rates on an uptrend, it can be an appropriate juncture to consider our SPA feature. This feature allows the member to capture, at prepayment, changes in the fair value of the advance which are favorable to the member. Contact Member Services Desk to discuss.
Looking for more information on the above topics? We’d love to speak with you!
Questions?
If you wish to receive the MSD Weekly Market Update in .pdf format (includes FHLBNY rate charts) or to discuss this content further, please email the MSD Team.