Member Services Desk
Weekly Market Update
Economist Views
Click to expand the below image.
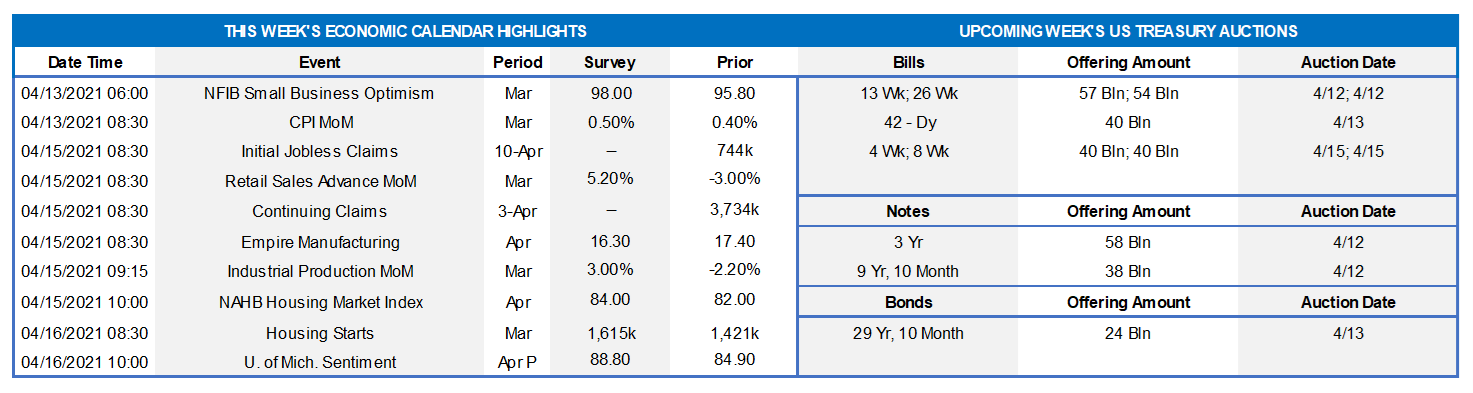
Market participants will contend with an exceptionally crowded economic data and Fed speaker calendar this week. Key business activity metrics – retail sales, industrial production, and housing starts – are all expected to have rebounded last month from weather-depressed levels in February. Consensus projections, if realized, likely will prompt forecasters to boost their current projections for Q-1 real GDP growth. Fed officials will make a dozen public appearances over the April 13-15 span, the most closely followed of which should be Chair Powell’s speech to the Economic Club of Washington and Vice Chair Clarida’s discussion of the central bank’s updated policy framework.
NFIB Small Business Optimism Index: Upbeat labor-market soundings suggest that small business sentiment improved markedly in March. Indeed, the National Federation of Independent Business’ composite optimism gauge probably moved above the century mark for the first time since last November, from 95.8 in February.
Consumer Price Index: Higher retail energy prices, along with an anticipated acceleration in core goods and services costs, likely propelled the CPI .5% higher in March, following a .4% rise in the preceding month. Excluding projected movements in food and energy costs, the core CPI probably moved .2% higher during the reference period, after no change in February. The median Street projections, if realized, would place the overall and core CPIs 2.5% and 1.6% above their respective year-ago levels, straddling the Fed’s desired 2% target.
Retail & Food Services Sales: The Census Bureau’s update on retail activity will allow economists to update their forecasts for Q-1 consumer spending growth. Broad-based rebounds across a variety of segments likely propelled sales 5.0% higher in March, more than offsetting the 3.0% prior-month decline. Particular attention will be paid to control sales excluding auto, building materials and gasoline purchases. Barring any prior-month revisions, the 5.5% jump anticipated by the consensus would place core purchases over Q-1 a whopping 26% annualized above their Q-4 average.
Empire State Manufacturing Survey: The expansion of local factory activity likely entered its tenth month in April, with the extent of gains narrowing slightly from March’s reported breadth. The business conditions diffusion index – the percentage of respondents experiencing a pickup in activity less those witnessing a decline – is expected to dip to 16.5% from 17.4% in the prior month.
NAHB Housing Market Index: Home-builder sentiment likely improved at the beginning of the traditional spring buying season, propelling this gauge of sales and prospective buyer traffic closer to the record high reading of 90 recorded last November.
Housing Starts & Building Permits: A return to more normal weather patterns probably pushed groundbreakings and residential construction applications higher in March from the depressed levels recorded in the prior month.
Federal Reserve Appearances:
Apr. 13: San Francisco Fed President Daly to take part in a Federal Reserve Event on Racism and the Economy.
Apr. 14: Fed Chair Powell to take part in a virtual moderated discussion hosted by the Economic Club of Washington.
Apr. 14: Federal Reserve to Release Beige Book Summary of Commentary on Current Economic Conditions.
Apr. 14: Fed Vice Chair Clarida to discuss new monetary policy framework at a virtual event hosted by the Shadow FOMC.
Apr. 14: Atlanta Fed President Bostic to take part in virtual discussion on redesigning cities to tackle systematic racism.
Apr. 15: Atlanta Fed President Bostic to take part in a virtual discussion on economic equality.
Apr. 15: San Francisco Fed President Daly to give virtual speech on financial stability and monetary policy.
Click to expand the below images.
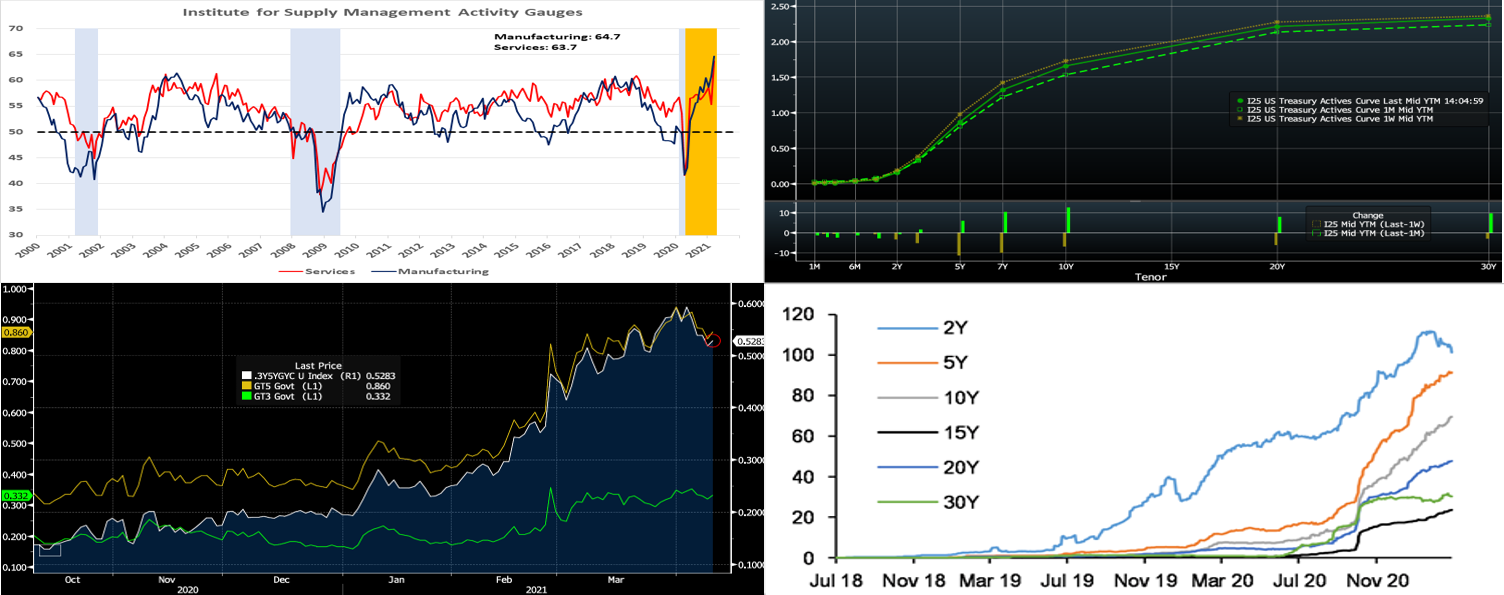
CHART 1 – UPPER LEFT
Source: Institute for Supply Management, FRB St. Louis, FHLBNY. Echoing the strength in its manufacturing barometer and consistent with district Fed canvasses, the ISM’s Services PMI leaped by 8.4 ppts to 63.7% in March — the strongest reading since the survey’s inception in July 1997. Last month’s sounding was the 10th consecutive reading in expansionary territory and points to a marked pickup in business activity in response to recent fiscal stimulus and COVID-19 vaccine distributions. All index components contributed to March’s gain. The Business Activity Index jumped by 13.9 ppts to a record 69.4% during the reference period. The New Orders Index climbed by a hefty 15.3 ppts to 67.2%, also an all-time high. Consistent with the details of the March jobs report, the Employment Index rose by 4.5 ppts to 57.2%. Prices paid by service organizations for materials and services increased in March and at a faster pace than in February. External readings were mixed during the reference period. The New Export Orders Index declined by 2.1 ppts to 55.5%, while the imports gauge edged 0.2 ppt higher to 50.7%.
CHART 2 – UPPER RIGHT
Source: Bloomberg. Note: top pane is yield (%), bottom pane is change (bps). Led by the belly (4 to 10-year sector) of the curve, in a retracement of the prior week’s move, UST yields dipped lower week-over-week. While shorter maturities finished 3-4 bps lower, the 4 through 7-year sector was ~7 to 11 lower, the 10-year ~5 lower, and the 20 to 30-year a few bps lower. The 5-year point led the move when, in reaction to the FOMC Minutes released mid-week which reinforced the Fed’s “stay the course” posture of letting the recovery continue to see further actual (Fed-used term) progress, participants reconsidered the curve’s pricing of potential Fed hikes. Moreover, another week’s reprieve from UST auctions, plus high cash levels in the markets possibly moving out the curve, helped demand. The Covid-19 situation still threatens at elevated levels, but the accelerating trend in vaccinations continues to bolster economic activity and projections which, in turn, may continue to underpin the yield curve. Indeed, stronger-than-expected inflation data on Friday pushed rates up from the lows of the week.
CHART 3 – LOWER LEFT
Source: Bloomberg. Portrayed here is the yield on the 3-year and 5-year UST (both LHS,%) vs. the 3-year/5-year UST curve slope (RHS,%), over the last 6 months. While much of the overall curve steepening of recent months has been further out the curve, there has also been steepening in this sector, as this slope has risen from ~13 bps last October (denoted by the rectangle in chart) to now ~53 bps (red circle in chart). Therefore, there is now greater “rolldown” and mark-to-market cushion offered in putting funds to work a bit further out the curve. Hypothetically, if one buys a 5-year UST today with a .86% yield, the security in two years’ time be at par if 3-year yields are then .86%, or 53 bps higher than they are today.
CHART 4 – LOWER RIGHT
Source: JP Morgan, Bloomberg. The SOFR swap market continues its growth. Depicted here is a maturity breakdown of the risk outstanding, in $mn/bp terms, of the market. Activity in intermediates has posted a notable rise, as growth in participants and fixed-vs.-float structures have contributed to the market’s evolution. Please call the desk to learn more about SOFR products and topics.
FHLBNY Advance Rates Observations
Front-End Rates
Short-end Advance rates again finished unchanged week-over-week. Money Market Funds’ AUM dropped by ~$12.8bn on the week, led by Government-Only funds in which investors were possibly moving out the curve in search of yield (any yield literally, given where money markets are trading). Nonetheless, short rates were steady. The GSEs are placing larger sums into money markets. And the US Treasury General Account has been declining, thereby adding cash to the banking system. From a bigger-picture vantage point, the overall moderation in the supply of short paper, relative to high cash levels in the market, is expected to keep short-end rates relatively steady and under downward pressure in the year’s first half.
UST issuance overall is now net positive supply in that more is being issued than what the Fed is buying in its programs. However, with short UST rates at rock-bottom levels and the Fed on hold for a long period, rates are likely to persist in a near-term sideways to softer pattern. Importantly, weekly net T-bill issuance has been lower since 2020 and even negative at times in recent months, and Treasury has announced plans to shift issuance out the curve. The latest relief package and related borrowing likely will lead to an increase of T-bill auction sizes and positive net supply, but overall market supply/demand dynamics should keep short rates in check on the upside.
Term Rates
On the week, medium and longer-term Advance rates were ~4 to 10 bps lower, with the largest decreases in the 4 to 7-year sector. Kindly refer to the previous section for further color on relevant market dynamics.
On the UST supply front, this week ends a reprieve and brings 3/5/10-year auctions. Recent auction sizes have been of record size and a contributor to the curve’s moves in Q-1. The market will keep focus this week on further Covid-19 and infrastructure bill developments, while also monitoring a heavy economic data calendar, for any signs of market-moving potential.
New Product Alert: In order to satisfy member needs and provide greater product flexibility to match bond and derivative market conventions, FHLB-NY now offers SOFR-linked advances based on SOFR-index compounding. Note that this product is in addition to SOFR-linked advances based on SOFR-index averaging which have been offered since November 2018.
The Symmetrical Prepayment Advance Feature
With rates at or near multi-year lows, it is a compelling juncture to use the SPA feature on term advances. This feature allows member to capture, at prepayment, changes in the Fair Value of the advance which are favorable to the member. Contact us to discuss.
Looking for more information on the above topics? We’d love to speak with you!
Questions?
If you wish to receive the MSD Weekly Market Update in .pdf format (includes FHLBNY rate charts) or to discuss this content further, please email the
MSD Team.
Special Member Alert
The FHLBNY recently announced a newly expanded and flexible Disaster Relief Funding (DRF) advance program which offers discounted rate advances with maturities 1-mo and greater. Additionally, we have announced that PPP loans will be accepted as eligible collateral. Please contact us with any questions.