Member Services Desk
Weekly Market Update
This MSD Weekly Market Update reflects information for the week ending January 27, 2023.
Economist Views
Click to expand the below image.
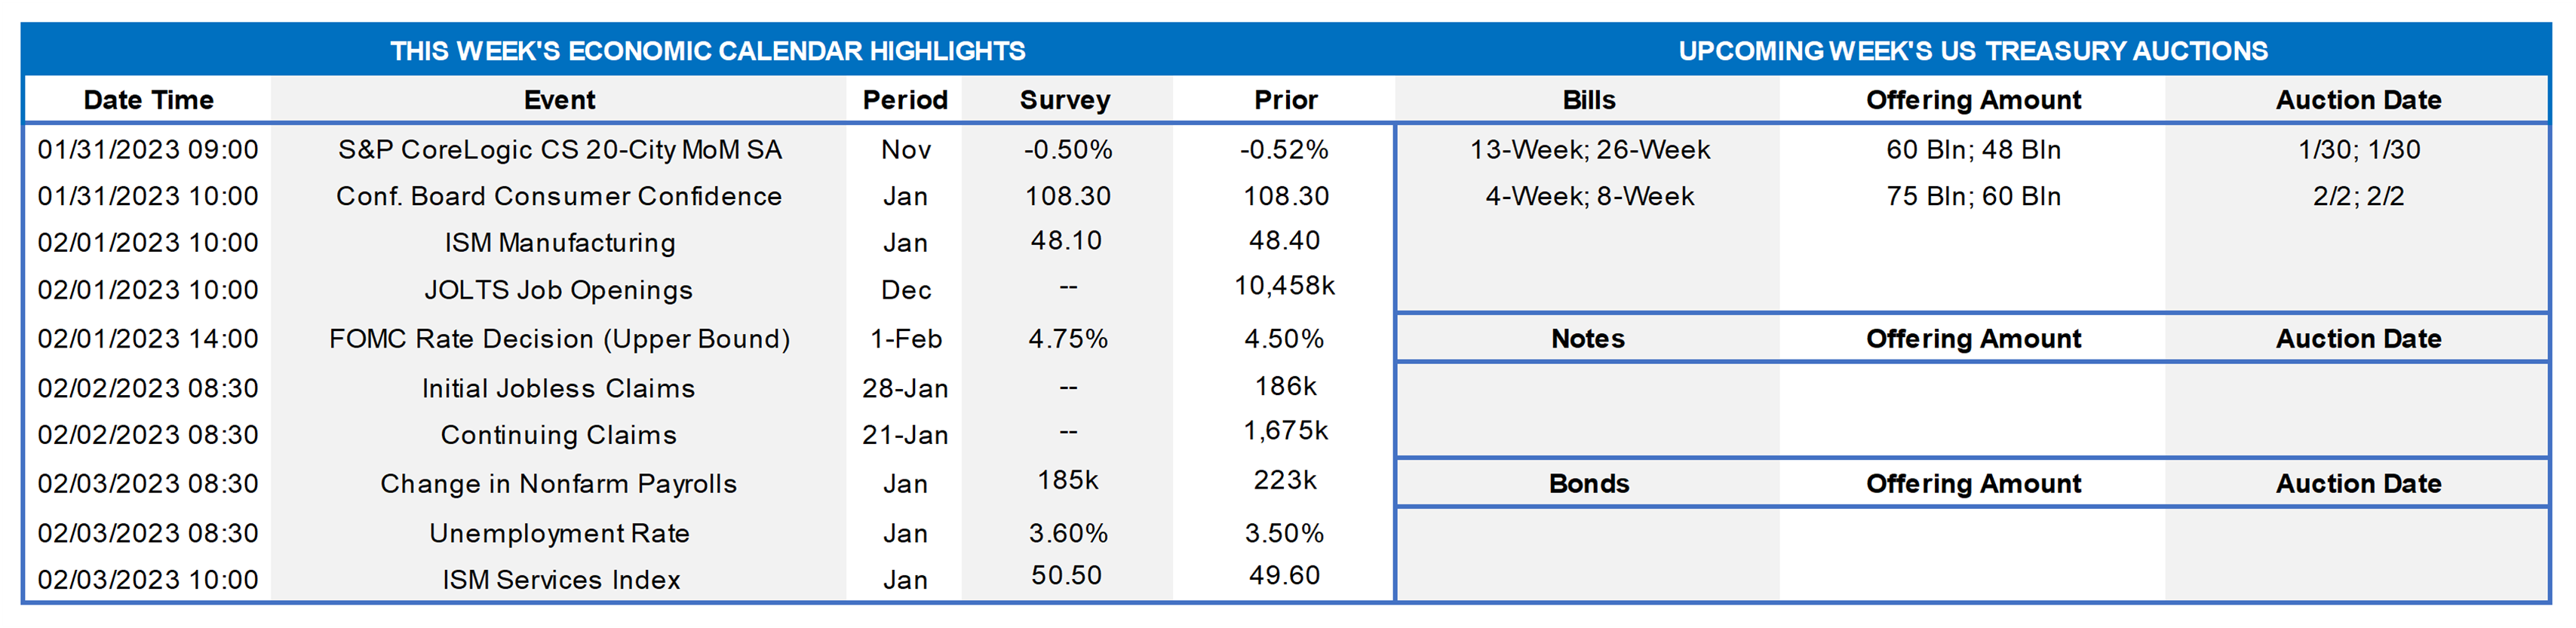
The Federal Open Market Committee (FOMC) decision will occupy pride of place during a hectic week. Policymakers are expected to raise the federal funds target rate range once again, with the market pricing near unanimity on a smaller 25 bps hike from 4½% to 4¾%. The post-meeting communiqué likely will note that recent indicators point to modest growth in spending and output, while also reiterating that job gains have been robust in recent months and the unemployment rate has remained low. Despite the recent moderation, the statement is likely to repeat that inflation remains elevated. Policymakers probably will remark that ongoing increases in the target range will be necessary to achieve a sufficiently restrictive stance to return inflation to the desired 2% target over time, yet acknowledge once again that, given the lags with which monetary policy affects economic activity and inflation, the cumulative tightening to date will be taken into consideration in determining the pace of further hikes. The FOMC will continue to reduce its holdings of UST and agency debt and MBS, as described in the Plans for Reducing the Size of the Federal Reserve’s Balance Sheet that was issued last May. On the data front, the employment situation report is expected to show that the hiring environment remained too tight for policymakers’ comfort in January.
S&P CoreLogic Case-Shiller (SPCLCS) 20-City Home Price Index: Home prices probably retreated for a fifth consecutive month across the twenty major metropolitan areas canvassed by SPCLCS in November. The .9% decline implied by available reports, after a .5% dip in October, would leave home selling prices 6.4% above those recorded 12 months earlier.
Conference Board Consumer Confidence: Echoing upbeat soundings from the University of Michigan, this gauge probably began 2023 on a high note, climbing by 7.7 points to 116 – its loftiest reading since the 125.1 posted in July 2021.
ISM Manufacturing Activity Index: Nationwide manufacturing activity likely dipped for a third straight month in January. District Federal Reserve Bank canvasses and other surveys suggest that the Purchasing Managers Index slipped to 47.7% at the beginning of the New Year from 48.4% in December.
JOLTS Job Openings: A reported dip in online help-wanted postings suggests that total job openings contracted by 110K to a four-month low of 1.35mn in December. Given the 278K decline in civilian unemployment during the reference period, that result would leave the gap between available positions and the jobless at 4.62mn. Put another way, there likely were a little over 1.8 jobs available per unemployed person nationwide at the end of last year.
Employment Situation Report: Boosted by the return of 36K striking graduate students at the University of California, nonfarm payrolls likely swelled by 280K in January – the largest net job gain since last August. The Street is expecting the unemployment rate to edge one tick higher to 3.6% during the reference period, but difficulties in predicting gyrations in the civilian labor force make that forecast highly uncertain. Capped by a comparatively early establishment survey period, average hourly earnings probably continued apace, climbing by .3% and thereby placing the closely followed nominal compensation gauge 4.3% above its year-ago level.
ISM Nonmanufacturing Activity Index: Service-producing activity likely expanded in January, with this barometer climbing to 51.2% from the weak 49.6% reading posted in the prior month.
Federal Reserve Appearances:
- Feb. 1 FOMC monetary policy decision.
- Feb. 1 Federal Reserve Chair Jerome Powell to hold press conference following FOMC meeting.
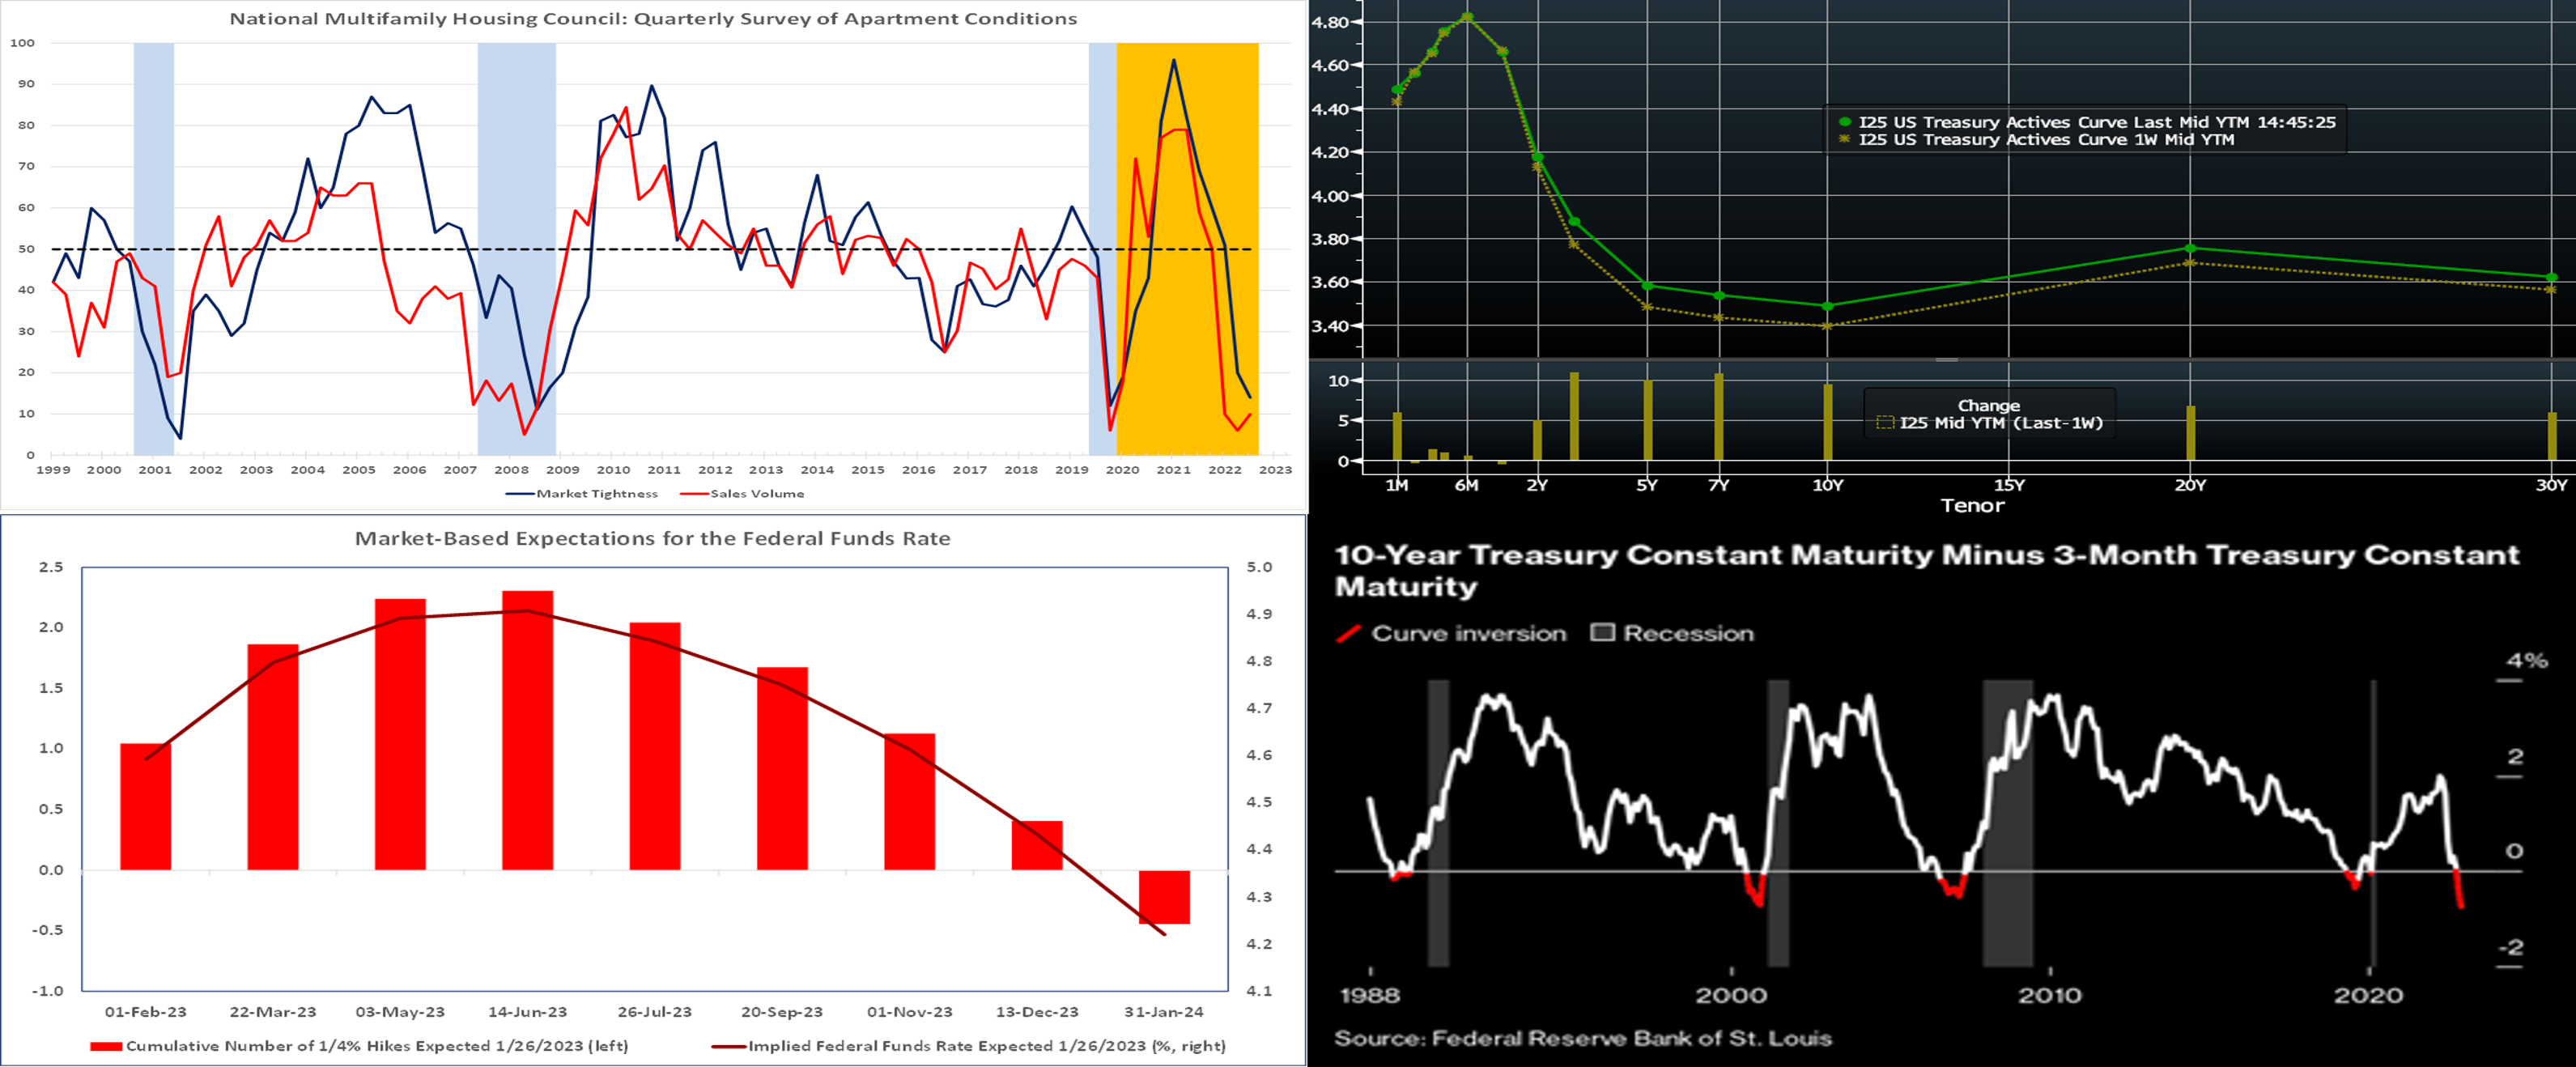
CHART 1 UPPER LEFT
Source: National Multifamily Housing Council (NMHC); National Bureau Economic Research; FHLB-NY. Notes: Diffusion indexes are calculated by taking one-half the percentage difference between positive and negative responses and adding 50; blue-shaded areas denote recessions, orange-shaded area highlights current expansion. Apartment market conditions weakened further in the NMHC’s Quarterly Survey of Apartment Market Conditions for January 2023, with the market tightness, sales volume, equity financing, and debt financing gauges all registering well below the 50-point breakeven mark. According to the NMHC, the Fed’s tightening cycle is having its intended effect on prices, with monthly rents decreasing nationwide. The trade association noted that, while rents are still higher than at this time last year, they represent the past not the current pricing environment. The backup in interest rates has also triggered a higher cost of debt financing, prompting buyers to seek higher rates of return. With sellers unwilling to budge much on pricing, apartment transaction volume has largely dried up.
CHART 2 UPPER RIGHT
Source: Bloomberg. Top pane is yield (LHS, %), bottom pane is change (bps). UST term yields moved 5 to 11 bps higher week-over-week, led by the 3 to 10-year sector. With the Fed in blackout mode heading into the upcoming meeting, the rates markets are somewhat marking time. A heavy dose of UST supply this past week, along with Thursday’s better-than-consensus Q4 2022 GDP report, added some upward pressure to yields. The upcoming week’s FOMC outcome and then Friday’s jobs report should influence direction ahead.
CHART 3 LOWER LEFT
Source: Bloomberg; FHLB-NY. Given the imminent FOMC decision, we revisit market-based (futures and swaps) pricing for the path of the effective Fed Funds rate (currently trading at 4.33%). For the outcome this coming week, the market prices a 100% probability of 25 bps and a minimal (~6%) chance of a 50 bps hike. Thereafter in 2023, the market prices for a slowing pace of hikes and then the potential for a policy reversal, with the peak rate at ~4.915% in June and subsequent declines to ~4.45% in December and ~4.24% at month-end January 2024. As we have mentioned often herein, this pricing is directly at odds with various Fed officials’ comments advocating a “higher for longer” and/or “5 to 5.25% soon” mantra on rates. With financial conditions having loosened recently (mortgage rates lower than Fall 2022, stocks a bit higher to begin 2023), the Fed may ponder a bigger move this week. But with recent data reflecting slowing inflationary forces, in tandem with a still-growing economy (per the above-cited GDP report) and weakening yet still-healthy job market, odds favor the Fed opting for just a 25 bps hike at this stage.
CHART 4 LOWER RIGHT
Source: FRB St. Louis; Bloomberg. Various points on the UST yield curve are inverted; portrayed here is the 3-month vs. 10-year sector. The inversion now sits at a multi-decade low level (RHS, %). Note that previous inversions (marked in red) preceded economic recessionary periods (vertical bar shadings). Whether or not a recession occurs in the year ahead and to what extent is highly uncertain and debatable, but, and in line with the above color on the market’s pricing of Fed Funds, the market clearly prices for the Fed’s historically swift and steep hiking cycle to defeat inflation and then reverse in the coming years. Indeed, the “Breakeven inflation rate” on 10-year TIPS inflation bonds is ~2.32%. This week’s FOMC meeting should shed light on the Fed’s course going forward.
FHLBNY Advance Rates Observations
Front-End Rates
- Short-end rates moved higher week-over-week by 3 to 10 bps, with 2-week to 1-month tenors leading the move, as these maturity dates crossed well into the timeline of the Fed’s expected rate hike this coming week. Please see the previous section for more specific Fed-pricing color.
- Given the Fed’s tightening and data-dependent posture, rates will be most responsive to this week’s FOMC result.
Term Rates
- The longer-term curve moved ~7 to 12 bps higher week-over-week, led by the 2 to 7-year sector and generally mirroring moves in USTs and swaps. Kindly refer to the previous section for relevant market color. The advance curve remains inverted out to 5-year, thereby offering opportunities to extend in advance duration for minimal or lower coupon cost. The flat curve and still relatively high implied volatility environment also can serve to make putable advances more compelling.
- On the UST term supply front, this upcoming week serves a reprieve from auctions. Corporate bond issuance is likely to maintain its early-year heady pace. Supply has been easily absorbed this month, owing to strong fixed income demand. Kindly call the Member Services Desk for information on market dynamics, rate levels, or products.
Product Alert: FHLBNY is pleased to announce the reintroduction, after a temporary suspension owing to Libor-cessation, of the Putable Advance, Fixed-Rate with SOFR Cap Advance, and ARC with SOFR Cap/Floor Advance. The Callable Advance continues to be offered. This expansion of the product menu will provide members with more options and flexibility for the management of funding and/or hedging needs.
Forward Start Advance (FSA): For members with upcoming borrowing or refunding plans, consider the FSA as a method to opportunistically “lock in” rates before advance settlement date. Please contact the Member Services Desk at (212) 441-6600 for more information.
The Symmetrical Prepayment Advance Feature
For those anticipating term funding needs, and with rates on an uptrend, it can be an appropriate juncture to consider our SPA feature. This feature allows the member to capture, at prepayment, changes in the fair value of the advance which are favorable to the member. Contact Member Services Desk to discuss.
Looking for more information on the above topics? We’d love to speak with you!
Questions?
If you wish to receive the MSD Weekly Market Update in .pdf format (includes FHLBNY rate charts) or to discuss this content further, please email the MSD Team.