Member Services Desk
Weekly Market Update
This MSD Weekly Market Update reflects information for the week ending October 27, 2023.
Economist Views
Click to expand the below image.
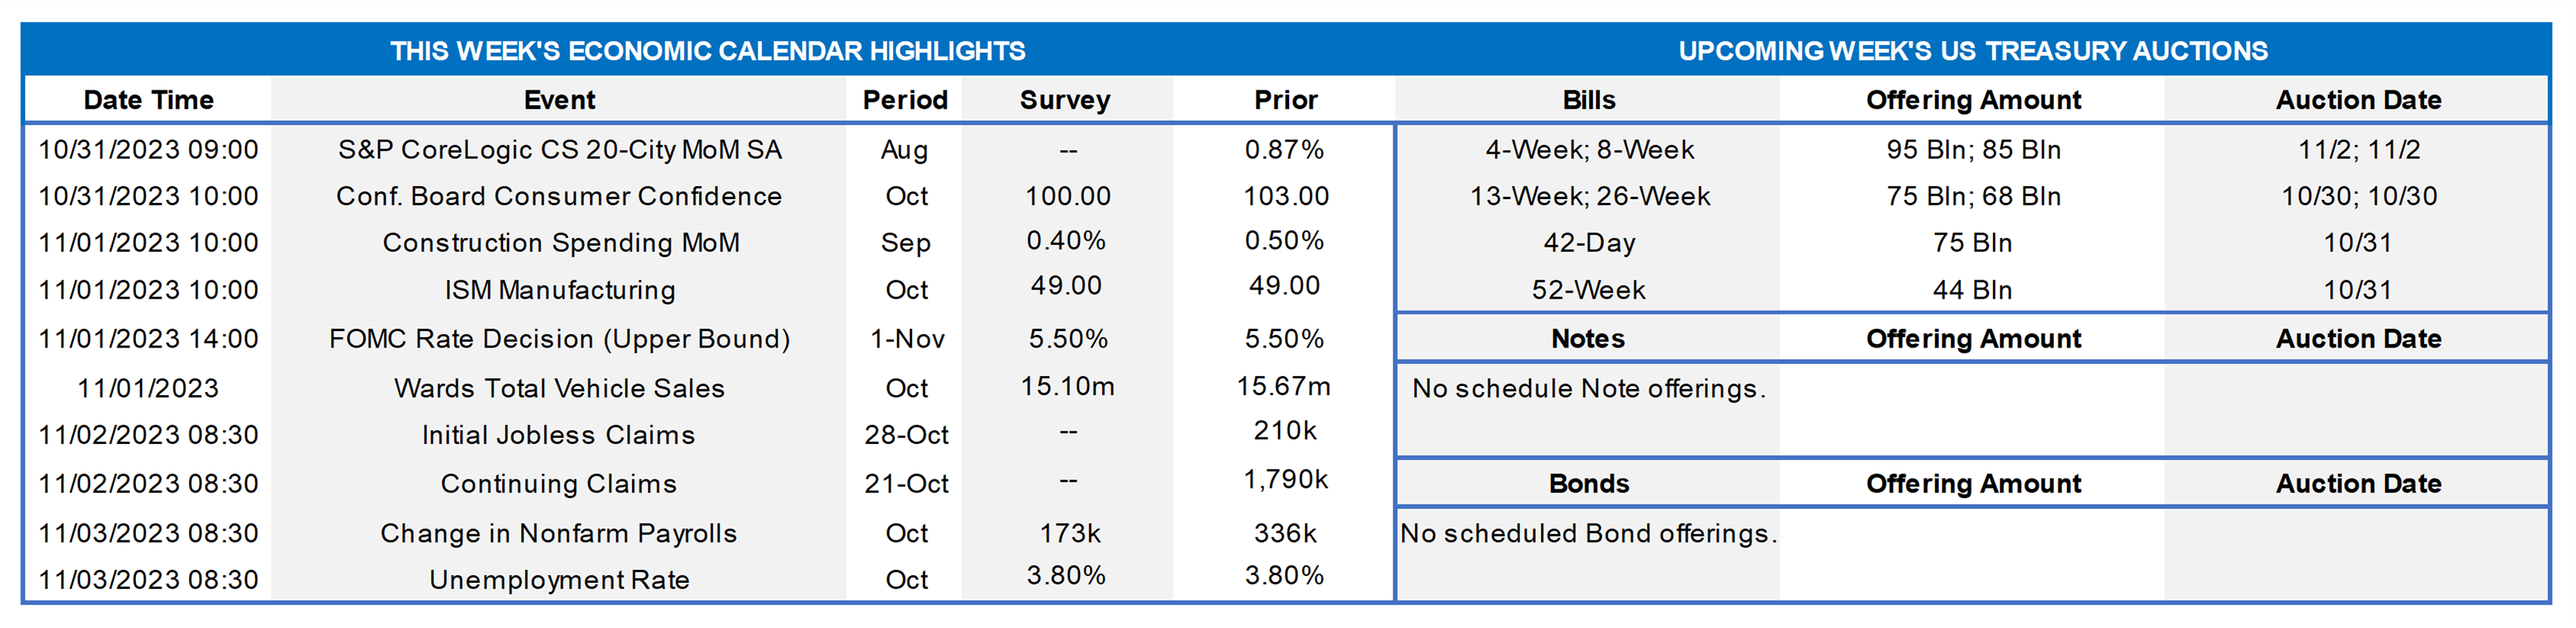
The Federal Open Market Committee meeting will be the marquee event this coming week. Policymakers are expected to leave the target range for the fed funds rate unaltered once again at 5¼% to 5½%. Given the continuing string of positive data surprises, the post-meeting communiqué likely will reiterate that the economy has been expanding at a solid pace. The statement can be expected to repeat that job gains have been robust in recent months, unemployment is low, and inflation remains elevated. Consistent with the current data dependency of policy, the communiqué probably will omit any forward guidance on rates. The statement likely will point out once again that in determining the extent of future increases in the fed funds rate target range, policymakers will consider the cumulative tightening of monetary policy, the lags with which monetary policy affects economic activity and inflation, and economic and financial developments. A wide range of information, including readings on labor market conditions, inflation pressures and inflation expectations, and financial and international developments will continue to be monitored in assessing the appropriate policy stance. The FOMC will continue to reduce its holdings of UST and agency debt and agency MBS, as described in the Plans for Reducing the Size of the Federal Reserve’s Balance Sheet that was issued last year. To date, runoffs of maturing securities have pared the System Open Market Account, or SOMA, to $7.395trn from the $8.495trn peak reached in July 2022.
S&P CoreLogic Case-Shiller (SPCLCS) 20-City Home Price Index: Home prices probably climbed .7% higher in August across the twenty major metropolitan areas canvassed by SPCLCS, boosting the cumulative rise over the latest six months to 4.7%. The anticipated increase, if realized, would place the average selling price nationwide 2% above that recorded 12 months earlier.
Conference Board Consumer Confidence: Available sentiment soundings suggest that the gauge tumbled to a 15-month low of 95.5 in October from the 103 posted in September.
Construction Spending: The nominal value of new construction put-in-place likely rose by .5% in September, boosting the cumulative increase since the end of last year to 8.3%.
ISM Manufacturing Activity Index: The ongoing contraction in nationwide manufacturing activity probably marked its 13th month in October. Indeed, district Federal Reserve Bank canvasses suggest that the Institute for Supply Management’s (ISM) Purchasing Managers Index likely dipped to 48.5% from 49% in September.
Motor Vehicle Sales: Purchases are expected to have retreated by 3.6% to a seasonally adjusted annual rate of 15.1mn in October, erasing all but a fraction of the gain recorded in the prior month.
Employment Situation Report: Labor market conditions probably remained tight at the beginning of Q4. Nonagricultural businesses likely added 250K net new workers in October, almost matching the 266K average witnessed over the July-September span. Weekly jobless claims reports and consumer-sentiment data suggest that the civilian unemployment rate moved one tick higher to 3.9% during the reference period – the highest reading since the 4% posted at the beginning of 2022. Despite a comparatively early establishment survey period, average hourly earnings probably climbed by .3% during the reference period, after a surprisingly modest .2% gain in September. If realized, that result would place nominal compensation 4% above the $32.66 per hour received a year earlier.
ISM Services Activity Index: Activity probably expanded for a tenth straight month in October, albeit at a marginally slower clip than in September, with the gauge likely slipping to 52.5% from 53.6%.
Federal Reserve Appearances:
- Nov. 1 Federal Open Market Committee monetary policy decision.
- Nov. 1 Federal Reserve Chair Jerome Powell post-FOMC meeting press conference.
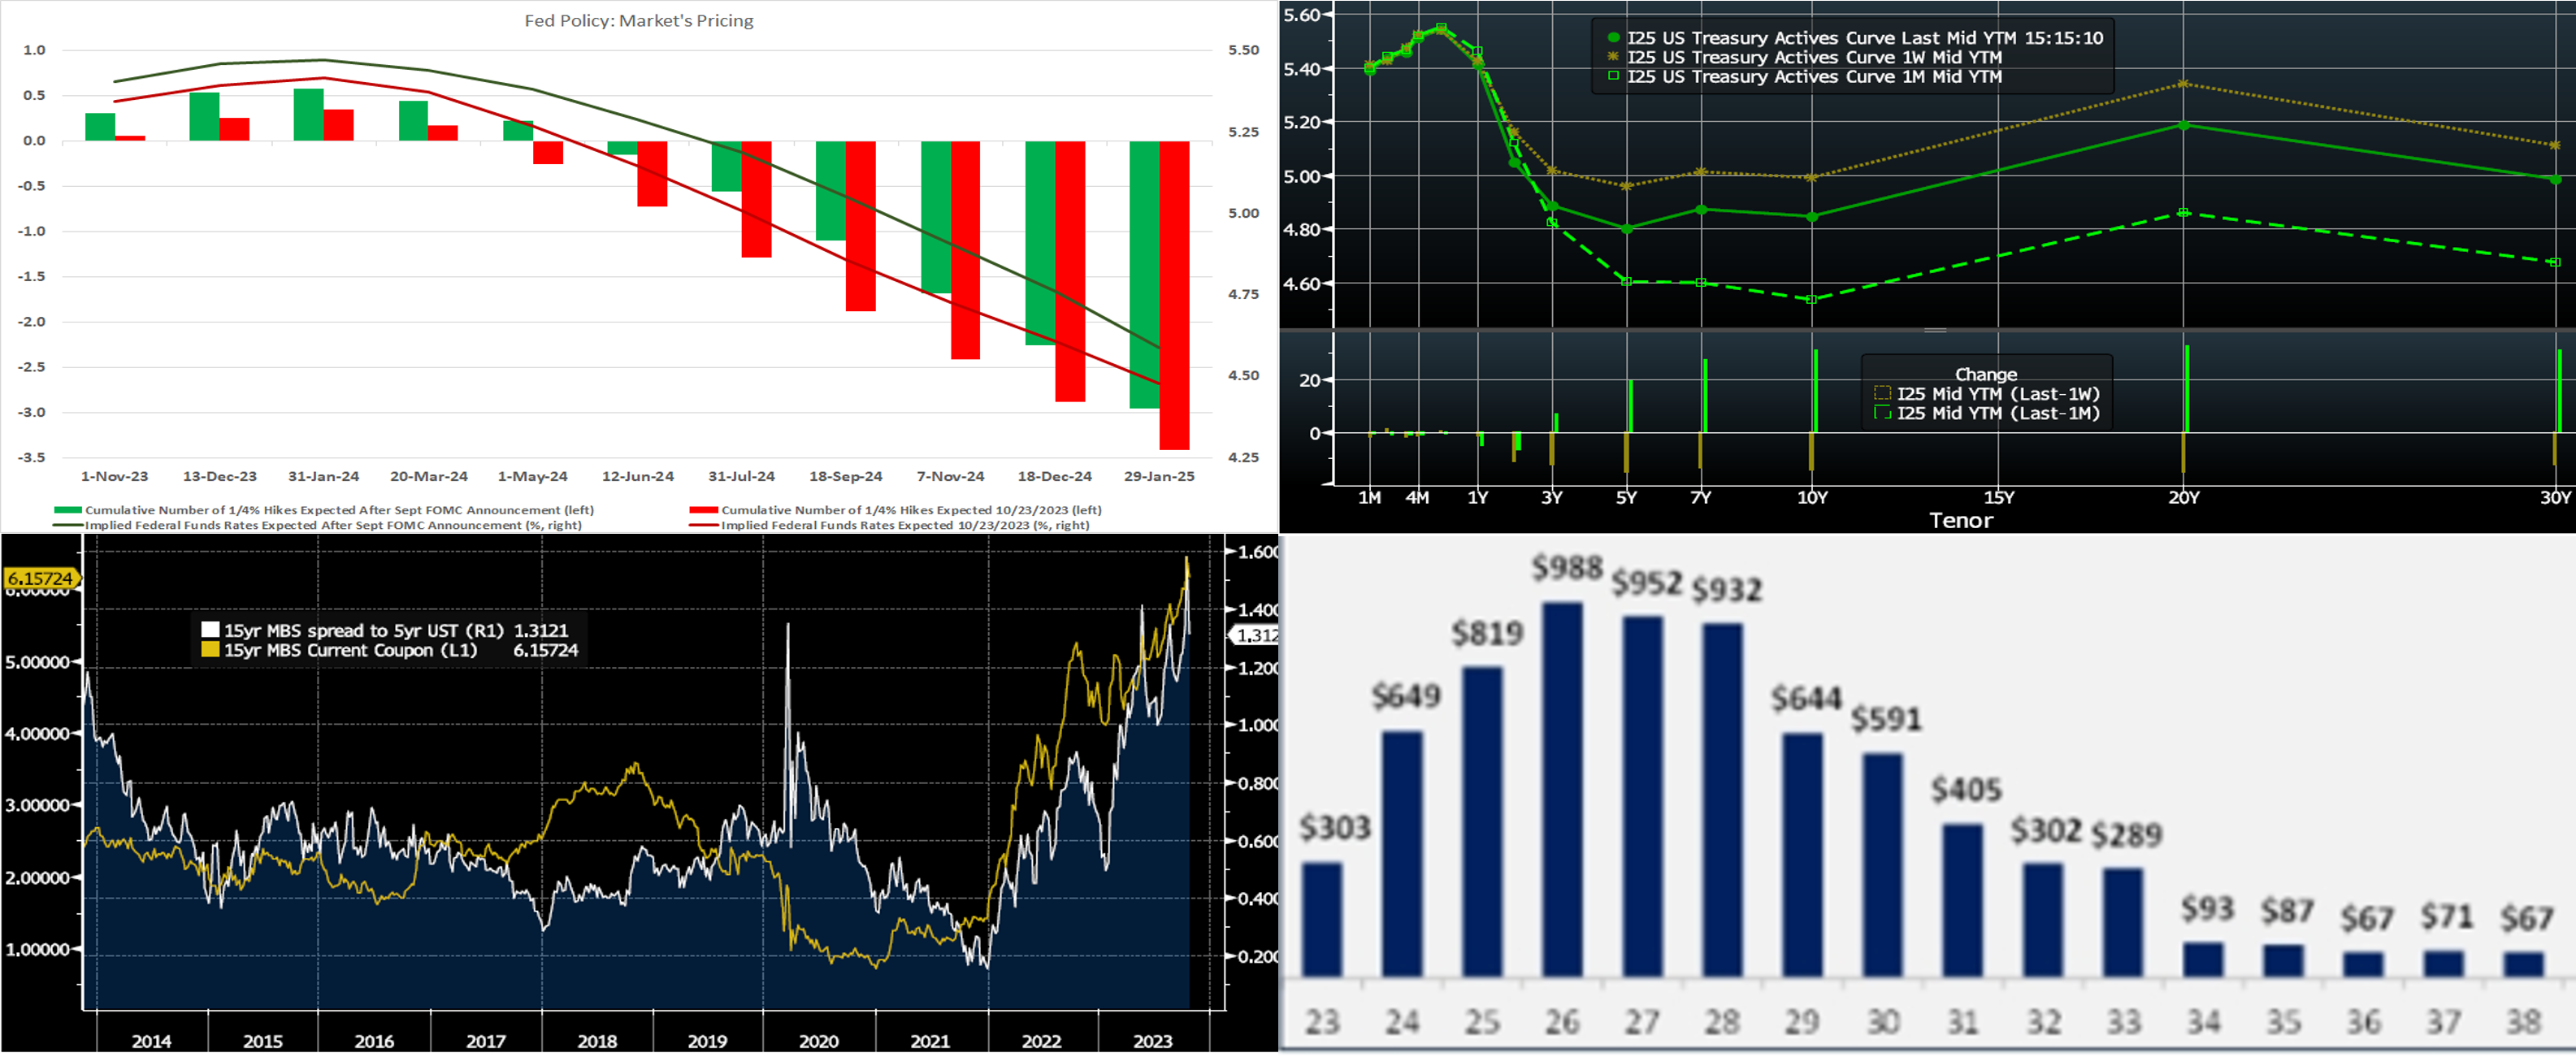
CHART 1 UPPER LEFT
Source: Bloomberg; FHLB-NY. Shown here, as of midday Thursday, is the market’s current (Red) pricing (from OIS swaps) of the prospective Fed policy path versus just after the September FOMC (Green). Somewhat surprisingly, given the notable selloff in bonds over the past month, the current pricing is a bit “softer” than after the last meeting. Basically, the market has trimmed the chances of another hike and has slightly increased the odds/extent of cuts in the back half of 2024. With the rise in longer term rates serving to tighten financial conditions and many Fed members adopting less hawkish language recently, the market has adjusted its pricing accordingly. For the upcoming FOMC, there is only a 6% probability of a 25 bps hike now priced into the curve, with the market anticipating another pause and then higher chances of additional pauses at the next few meetings – in essence, the market now prices a higher probability that the Fed’s hiking cycle could be complete.
CHART 2 UPPER RIGHT
Source: Bloomberg. Top pane is yield (LHS, %), bottom pane is change (LHS, bps). From last Thursday afternoon to this one, the UST curve retreated from its upward march of the past month. Roll-adjusted for new on-the-runs, the 2-year was ~8 bps lower, and the 3-year-and-out sector was ~10 to 14 bps lower. Short-covering and perhaps ongoing Middle East war concerns were potential contributors to the move. Thursday’s GDP report was strong, but the core PCE figure was lower than expected, and this data slice of slowing inflation prompted UST demand. All eyes will now fall on the FOMC. In terms of market-implied pricing of the Fed, the peak funds rate in February now stands at ~5.42%, ~2 bps lower than last week and equating to ~34% chance of another 25 bps hike. The years 2024 and 2025 decreased from a week ago as the market increased the chances/extent of rate cuts in that timeframe; the year-end 2024 forward was ~16 bps lower week-on-week, now ~4.60%.
CHART 3 LOWER LEFT
Source: Bloomberg. This year has been dominated by the theme of deposit and net interest income/margin pressures for financial institutions. Indeed, fresh Q3 earnings reports generally reflected stabilizing deposits but higher costs for them. What if your institution is not firmly in the “same boat” but rather in a position to put some funds to work? Although still at risk of further upside pressure, yields and spreads in the MBS and Municipals space are at the highest levels in years. Shown here is the 15-year MBS Current Coupon (Gold, LHS, %, imputed yield of a par-priced security) and its spread (White, RHS, %) to the 5-year UST, a similar duration bond. As can be seen, they both are at or near high points of the last decade. Also shown is the Bloomberg Muni Bond Index Yield (Green, LHS, %), which is at a high point too. Of special and related note, Muni bonds are now eligible collateral at the FHLB-NY; for more details, please see our latest Bulletin.
CHART 4 LOWER RIGHT
Source: Wolfe Research; Bloomberg. Many strategists have declared that the recent upsurge in longer term rates is helping “to do the Fed’s work for it”. Fed policy tends to work on the economy with a time lag, and higher rates appear to be exerting progressively more impact; indeed, housing sector data has reflected the impacts, with mortgage applications and existing home sales hitting multi-decade lows in the past week. Shown here is the distribution of non-financial institution corporate debt maturities ($bn) over the coming years. As can be seen, there is a significant ramp-up in maturities in the next few years. Corporations and businesses with maturing debt may face a challenging, or at least more expensive, refinance/rollover dynamic if current rate levels persist. Since many higher-rated or large companies were able to issue longer-term debt when rates were low, a potentially large cohort of relatively weaker-rated issuers may comprise the bulk of these maturities in the next few years.
FHLBNY Advance Rates Observations
Front-End Rates
- Short-end rates were mildly mixed week-over-week, with the very short tenors up a bp but 2-month-and-out down a bp or two. Net T-bill supply remains positive, given announcements from the Treasury regarding upsized auctions and issuance needs. But the supply continues to be absorbed relatively well, as Money Market Funds (MMFs) switch from the Fed’s RRP to T-bills with competitive yields. Moreover, although off the recent high points, MMFs currently stand at or near all-time high AUM levels.
- The FOMC meeting on November 1, along with the jobs report on the 3rd, will likely be the main events this upcoming week.
Term Rates
- The longer-term curve, generally mirroring the moves in USTs and swaps, retreated lower by 11 to 15 bps in the 2-year-and-out sector. Please call the Member Services Desk for further information on markets and/or products and pricing.
- On the UST term supply front, the upcoming week serves as a welcome reprieve from fresh auctions. Note that UST auctions usually occur at 1pm and can cause volatility around that time. Please contact the Member Services Desk for further information on market dynamics, rate levels, or products.
Price Incentives for Advances Executed Before Noon – In effect as of Tuesday, September 5, 2023 – The FHLB-NY is pleased to now offer price incentives for advances executed before Noon each business day. These pricing incentives offer an opportunity to provide economic value to our Members, while improving cash and liquidity management for the FHLBNY. For further details, kindly refer to the bulletin.
The Symmetrical Prepayment Advance Feature
For those anticipating term funding needs, and with rates on an uptrend, it can be an appropriate juncture to consider our SPA feature. This feature allows the member to capture, at prepayment, changes in the fair value of the advance which are favorable to the member. Contact Member Services Desk to discuss.
Looking for more information on the above topics? We’d love to speak with you!
Questions?
If you wish to receive the MSD Weekly Market Update in .pdf format (includes FHLBNY rate charts) or to discuss this content further, please email the MSD Team.