Member Services Desk
Weekly Market Update
This MSD Weekly Market Update reflects information for the week of August 16, 2021.
Economist Views
Click to expand the below image.
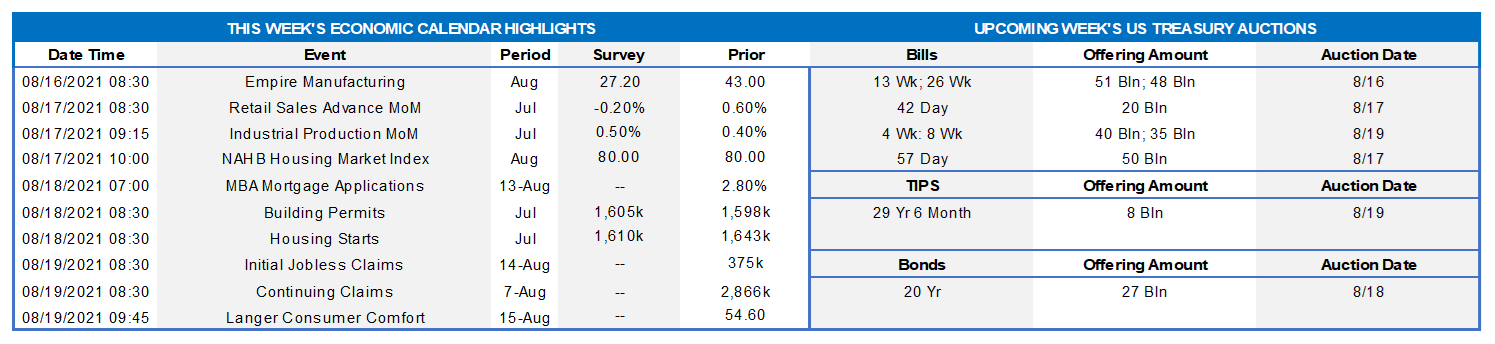
The economic data flow will accelerate considerably this week, with a variety of key inputs into economists’ current-quarter real GDP projections slated to be released. The already reported decline in unit motor vehicle sales points to a dip in retail sales in July. Industrial production and new residential construction activity likely rose last month. Weekly labor-market soundings probably remained on the mend. The median forecast for Q3 real GDP growth calls for a 6.9% annualized gain, up from the spring quarter’s 6.5% advance. Federal Reserve Chair Jerome Powell and Minneapolis Federal Reserve Bank President Neel Kashkari will hold virtual town hall meetings. The minutes of the July 27-28 Federal Open Mark Committee meeting will be scrutinized closely for policymakers’ thoughts on tapering the central bank’s asset-purchase program.
Empire State Manufacturing Survey: Factory activity in New York State likely expanded for a 14th straight month in August, though the pace of growth is expected to recede from July’s record clip. The net percentage of respondents experiencing an improvement in general business conditions is less than those witnessing a decline probably narrowed to 33% from the all-time high of 43% posted in the prior month.
Retail & Food Services Sales: The Census Bureau’s update on retail activity in July will provide important information on consumer spending growth at the beginning of the summer quarter. Paired by a reported pullback in motor vehicle purchases, retail and food services sales likely dipped by .3% last month, following a stronger-than-expected .6% rise in June. As always, market participants will be paying particular attention to so-called control sales excluding auto, building materials and gasoline purchases in this week’s report. Barring any prior-month revisions, the .3% dip anticipated by the Street would place core purchases in July a modest .2% annualized above their spring-quarter average.
Industrial Production & Capacity Utilization: Powered by a durable goods-led rebound in factory output, industrial production is expected to have risen by .5% in July, after a .4% prior-month gain. With output likely eclipsing additions to productive capacity during the reference period, the overall operating rate probably climbed by a .3 percentage point to 75.7% – the highest reading since the pandemic prompted the closing of the economy in March 2020.
NAHB Housing Market Index: Home-builders’ appraisals of market conditions likely remained stable in early August. At 80, the NAHB Housing Market Index would be ten points shy of last November’s record high but well above the 50-point level associated with neutral conditions.
Housing Starts & Building Permits: A reported jump in construction hours worked suggests that starts probably rose above the three-month high seasonally adjusted annual rate of 1.64mn posted in June. Solid demand for dwellings points to a potentially large snapback in residential building permits in July, after the surprising 5.3% prior-month drop.
Jobless Claims: Initial and continuing claims under regular state unemployment insurance programs likely retreated during their latest respective reporting periods. Those figures continue to overstate the improvement in the labor market from the worst of the pandemic, however. Indeed, as of the week ended July 24, 12.1mn persons were receiving some sort of unemployment assistance, down from the pandemic peak of 32.4mn reached a year ago but still well above the 2.1mn prevailing before the shuttering of the economy. Using July’s level as a base, 7.5% of the civilian labor force were receiving some form of unemployment insurance payments three weeks ago.
Federal Reserve Appearances:
Aug. 17: Federal Reserve Chair Powell will host a virtual town hall meeting with educators across the country.
Aug. 17: Minneapolis Fed President Kashkari will hold a town hall with the Pacific Northwest Economic Regional Summit.
Aug. 18: The Federal Reserve will release the minutes of the July 27-28 FOMC meeting.
Click to expand the below images.
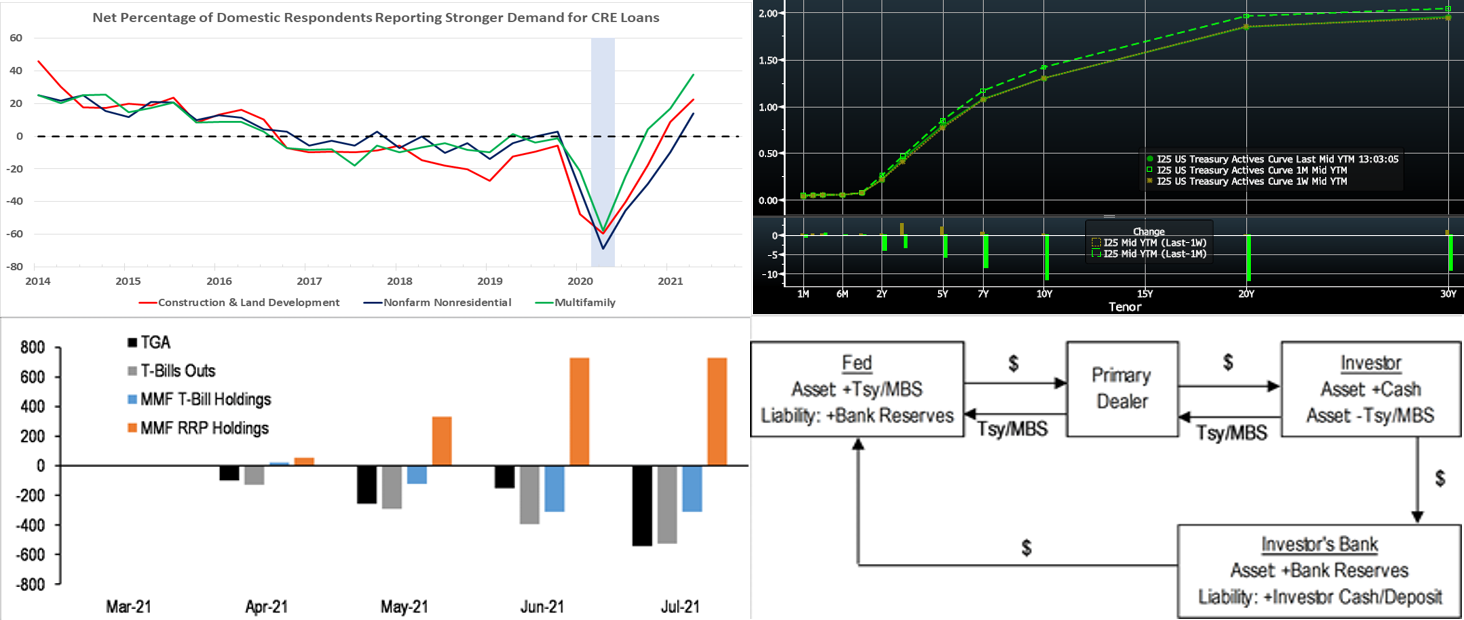
CHART 1 – UPPER LEFT
Source: FRB; FHLBNY. Note: Shaded area denotes recession. Piggybacking on last week’s optimistic chart on C&I loans from the Fed’s July 2021 Survey of Senior Loan Officers, lenders in the survey also reported stronger demand in Q2 for commercial real estate (CRE) loans -– construction & land development, nonfarm residential and multifamily. Standards eased for all types of CRE loans, marking the first such occurrence since the winter of 2014. At -18.1%, the net percentage of lenders reporting a tightening of credit standards for multifamily loans reached the lowest level since the Fed began collecting such data in 2013. More than doubling, the net percentage of lenders reporting stronger demand for multifamily construction loans reached an “all-time” high of 37.5%. These indications point towards higher borrower demand and a keener desire to book loans among lenders. For further color and/or more charts on this topic, please contact the desk.
CHART 2 – UPPER RIGHT
Source: Bloomberg. Note: top pane is yield (%), bottom pane is change (bps). Yields finished mostly unchanged to a tad higher in the week. After having traded notably higher all week, yields reversed course on Friday in reaction to a surprisingly weak, perhaps Delta variant-influenced University of Michigan Consumer Sentiment report. Week-over-week as of midday Friday, the 3 to 5-year sector closed a few bps higher, whereas the rest of the curve closed essentially unchanged. The previous rise in yields during the week was partly driven by a few Fed Board members expressing support for an earlier start to the tapering of securities purchases; also in the mix were UST auctions and a mid-week surge in corporate bond issuance. It should be noted that “sentiment data” can be somewhat unpredictable, and so the market will closely monitor the upcoming week’s “hard data” for a better guide on the economy and Fed policy timelines.
CHART 3 – LOWER LEFT
Source: JP Morgan. Amounts $bn, LHS. Consistently herein we have noted the various and persistent dynamics of the short-end rates markets, namely the Treasury General Account (TGA), T-bills supply outstanding (T-Bills Outs), and Money Market Funds (MMF) holdings. This chart provides an “easy-to-see” summary of the current short-rates sector backdrop. Treasury has been “spending down” their account at the Fed; in other words, they are allocating the funds raised in fiscal legislative programs and thereby increasing cash in the banking system. Meanwhile, weekly net T-bill issuance has been negative for months, as Treasury has moved issuance out the curve and/or financing needs have been less than anticipated. In turn, large MMFs have turned to the Fed’s Reverse Repurchase Program (RRP) as an investment alternative; the RRP yields .05% and hit fresh record amounts north of $1trn this past week. In sum, the backdrop is one of high cash levels in a supply-constrained environment.
CHART 4 – LOWER RIGHT
Source: JP Morgan. An additional provider of cash into the banking system has been the Fed’s securities purchases, otherwise known as Quantitative Easing (QE). Sticking with “easy-to-see” charts which may prove helpful for those less familiar, here is a flow diagram of the QE process. A few Fed Board members this week advocated for a quicker tapering of the securities purchase program, perhaps with an announcement in early Fall and subsequent start of “taper”. The “taper” will signal the removal of Fed accommodation and “easy money” policy.
FHLBNY Advance Rates Observations
Front-End Rates
Short-end Advance rates finished mostly a bp higher on the week. Money Market Funds’ AUM increased by ~$9.4bn this past week, thereby infusing demand for short paper (and the RRP, see previous section!). The overall supply/demand paradigm persists in suppressing rate levels, as the GSEs continue to invest large sums into money markets, the TGA continues its decline, and short-maturity paper is in short supply. The Fed’s RRP facility continues to experience strong demand.
UST issuance overall is now net positive supply in that more is being issued than what the Fed is buying in its programs. However, with short UST rates at rock-bottom levels and the Fed on hold for a long period, rates are likely to persist in a near-term sideways pattern. Importantly, weekly net T-bill issuance has been lower since 2020 and negative in recent months, and Treasury intends to shift issuance out the curve. Moreover, the looming federal debt ceiling may further constrain issuance. Further legislative packages and related borrowing may lead to an eventual increase of T-bill auction sizes and positive net supply, but for now overall market supply/demand dynamics should keep short rates in check from large moves to the upside.
Term Rates
The Advance rate curve was mixed from a week prior. Rates out to 2-year were roughly unchanged to a bp lower, while the 3 to 7-year sector closed 2 to 3 bps higher; the 10-year closed ~2 bps lower owing to improved market funding levels in the sector. Kindly refer to the previous section for further color on relevant market dynamics.
On the UST supply front, this week brings a 30-year TIPS and a nominal 20-year auction. A further uptick in corporate bond issuance is also possible post-earnings releases. In the week ahead, the market will monitor economic data and any Fed officials’ pronouncements regarding the taper of bond purchases.
Product Enhancement Alert: FHLBNY this past week announced an enhancement to the Callable Adjustable Rate Credit Advance (“Callable ARC”). The product features a 1-time call/cancel option (member’s option) to extinguish funding early at no cost via two distinct option structures, thereby giving members flexibility in meeting the demands of a fluctuating balance sheet. Given the shorter-term nature of the current borrowing environment, the minimum term for the Callable ARC has been lowered to 4-month (from the previous 7-month) for our 1-month-left-to-maturity call option (SOFR or 1-month Libor index available) to better meet our members’ needs. Meanwhile, the 3-year Non-Call 2-year product for SOFR continues to be offered to members for their longer-term needs.
New Product Alert: In order to satisfy member needs and provide greater product flexibility to match bond and derivative market conventions, FHLB-NY now offers SOFR-linked advances based on SOFR-index compounding. Note that this product is in addition to SOFR-linked advances based on SOFR-index averaging which have been offered since November 2018.
The Symmetrical Prepayment Advance Feature
With rates at or near multi-year lows, it is a compelling juncture to use the SPA feature on term advances. This feature allows members to capture, at prepayment, changes in the Fair Value of the advance which are favorable to the member. Contact us to discuss.
Looking for more information on the above topics? We’d love to speak with you!
Questions?
If you wish to receive the MSD Weekly Market Update in .pdf format (includes FHLBNY rate charts) or to discuss this content further, please email the MSD Team.
Special Member Alert
The FHLBNY recently announced a newly expanded and flexible Disaster Relief Funding (DRF) advance program which offers discounted rate advances with maturities 1-mo and greater. Additionally, we have announced that PPP loans will be accepted as eligible collateral. Please contact us with any questions.