Member Services Desk
Weekly Market Update
This MSD Weekly Market Update reflects information for the week of May 24, 2021.
Economist Views
Click to expand the below image.
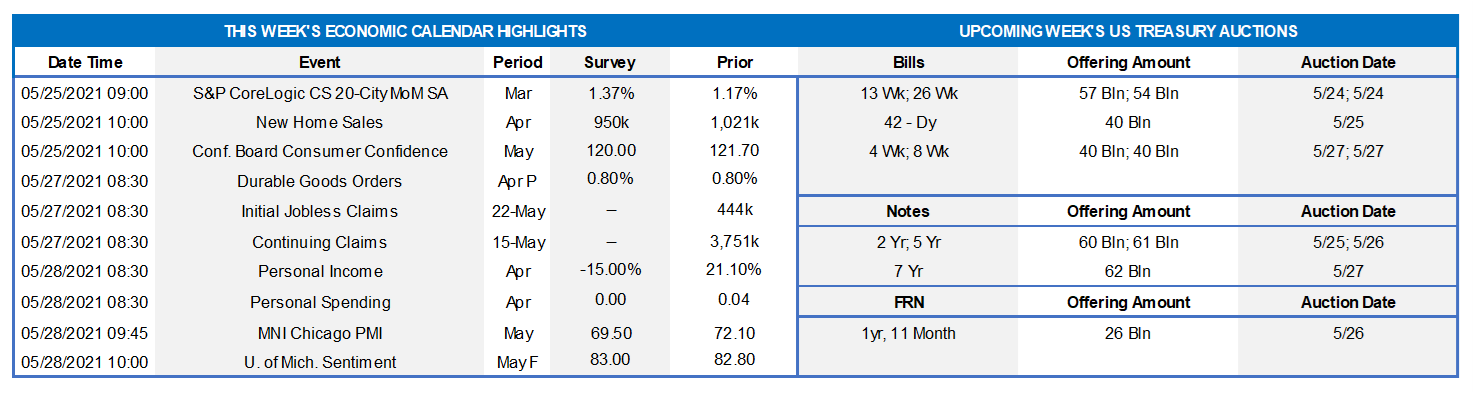
S&P CoreLogic Case-Shiller (SPCLCS) 20-City Home Price Index: Home prices probably remained on an uptrend in the twenty major metropolitan areas included in the SPCLCS survey. Indeed, the 1.5% increase anticipated by the Street in March, if realized, would place home selling prices a hefty 12.9% above the level prevailing twelve months earlier.
New Home Sales: Reported declines in single-family building permits and housing starts, suggest that closings on newly constructed dwellings remained on a saw-toothed path in April, retreating by 4% to a seasonally adjusted annual rate of 980K.
Conference Board Consumer Confidence: Sizable improvements in weekly sentiment soundings suggest that the Conference Board’s Consumer Confident Index probably climbed to 125.0 in May from 121.7 in April. That projection, if realized, would mark the rosiest reading since the 132.6 posted in February 2020 before the pandemic struck. As always, pay particular attention to the so-called labor differential – the percentage of survey respondents feeling that jobs are plentiful less those believing they are hard to get – for clues to the likely change in the unemployment rate this month.
Pending Home Sales: The number of homes entering contract nationwide is projected to have climbed by 0.5% in April, building on the 1.9% increase recorded in March. The estimated increase over the latest two month, if realized, would be consistent with a modest uptick in existing home sales in the National Association of Realtors’ May report.
Personal Income & Spending: Sans the massive lift from the federal support payments of the American Rescue Plan Act, personal income likely dropped by 14.8% in April, reversing over three quarters of March’s record-setting 21.1% leap. Consumer outlays on goods and services probably edged 0.4% higher during the reference period, after a 4.2% prior-month gain. With consumer inflation climbing by an estimated 0.6% during the reference period, real consumer outlays dipped by an implied 0.2%, placing April’s inflation-adjusted spending level a hefty 7.3% annualized above the Q1 average.
Federal Reserve Appearances:
May 24: Federal Reserve Governor Lael Brainard to speak at the Consensus 2021 crypto currency conference.
May 24: Cleveland Fed President Mester to make remarks at a panel discussion on diversity and Fed communication.
May 24: Atlanta Fed President Bostic to discuss the policy response to COVID-19 at a virtual conference.
May 24: Kansas City Fed President George to speak at an agriculture symposium hosted by her bank.
May 25: Chicago Fed President Evans to discuss the economy in a virtual presentation hosted by the Bank of Japan.
May 25: Fed Vice Chair for Regulation Randall Quarles to give semi-annual testimony before the Senate Banking Committee.
May 25: Fed Vice Chair for Regulation Randall Quarles to give virtual remarks on insurance regulation.
May 26: Fed Vice Chair for Regulation Randall Quarles to discuss the economic outlook at the Brookings Institution.
Click to expand the below images.
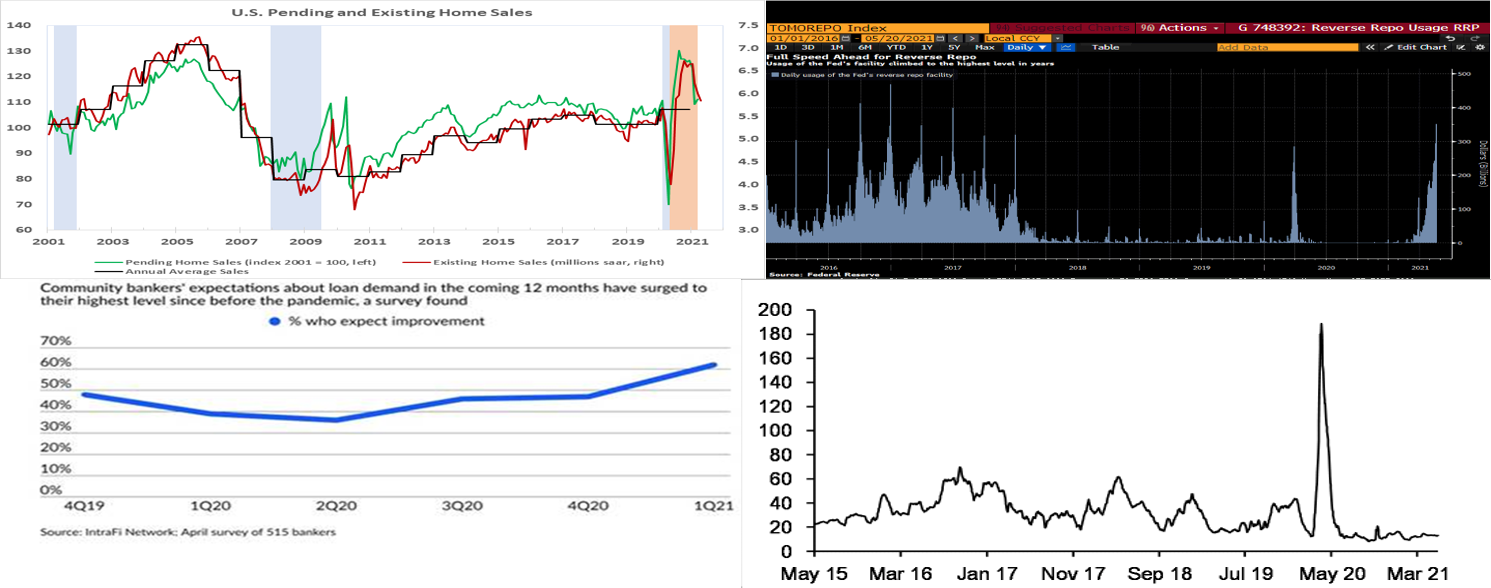
CHART 1 – UPPER LEFT
Source: National Association of Realtors and FHLBNY
The National Association of Realtors reported that existing home sales slipped by 2.7% to a seasonally adjusted annual rate of 5.85 million in April – the lowest level of closings since the 4.77 million posted last June. At variance with the median Street call for a 1.0% rise to 6.07 million, last month’s activity was consistent with contracts signed over the February-March span. With the exception of a modest increase in the Midwest, existing home sales retreated across the country in April. An encouraging sign, the stock of available homes on the market jumped by 10.5% to 1.16 million during the reference period – the highest inventory level since last November. Given the above movements, the months’ supply of homes at the latest sales pace moved three ticks higher to a six-month high 2.4 months. Home prices climbed across the Nation last month. The countrywide average selling price climbed by 3.3% to $364,800, while the median amount changing hands jumped by 4.7% to $341,600. Last month’s average and median selling prices represented respective 13.6% and 19.1% jumps from a year ago. Notes: Blue shaded areas denote recessions. Orange shaded area denotes period beyond April 2020 when probability that the economy was in recession dipped below 1%.
CHART 2 – UPPER RIGHT
Source: Bloomberg. The street takedown of the daily New York Fed Reverse Repo Program was at its highest level ($369 Billion) on May 21 since 2017. It has been steadily increasing since March as the FED tries to keep the Fed Funds rate in its target range as set by the FOMC. The Street is in search of collateral and the Fed’s administration of IOER and the RRP rate may need to rise by a few bps to avoid zero and negative rates, especially for MMF who have large short-term holdings.
CHART 3 – LOWER LEFT
Source: IntraFi Network. Survey of Banker’s expectations shows significant improvement in sentiment for increased loan demand in the coming months. For those with funding or ALM needs, term advances can make sense via SPA – use FSA if don’t need funds immediately – on special for one more week!!!
CHART 4 – LOWER RIGHT
Source: DTCC, JP Morgan. Depicted here is the spread between 3month Bank CP/CD and 3month T-Bills (bp). 8-9 bps has been the low point in this spread in recent years, as demonstrated in the current market by 3M Libor trending lower and T-Bills at historic lows. Yields in the short end are suffering and Banks are flush with cash and not offering attractive CD yields.
FHLBNY Advance Rates Observations
Front-End Rates
Short-end advance rates finished flat to a bp lower week-over-week. Money Market Funds’ AUM increased by ~$25bn on the week, led by a $33.4bn increase in Government-Only funds, thereby providing sustained demand for short paper. Meanwhile, the GSEs continue to invest larger sums into money markets, and the US TGA continues its decline. From a bigger-picture vantage point, the overall moderation in the supply of short paper, relative to high cash levels in the market, is expected to keep short-end rates relatively steady and under downward pressure in the year’s first half.
UST issuance overall is now net positive supply in that more is being issued than what the Fed is buying in its programs. However, with short UST rates at rock-bottom levels and the Fed on hold for a long period, rates are likely to persist in a near-term sideways to softer pattern. Importantly, weekly net T-bill issuance has been lower since 2020 and even negative in recent months, and Treasury has announced plans to shift issuance out the curve. The latest relief package and related borrowing may lead to an eventual increase of T-bill auction sizes and positive net supply, but overall market supply/demand dynamics should keep short rates in check on the upside.
Term Rates
On the week, medium and longer-term Advance rates were lower, in a “bear steepening” move. While 1-year & 3-year were up by 1 bps, 5-year and 10-year were down by 1 bp. Kindly refer to the previous section for further color on relevant market dynamics.
On the UST supply front, this week brings a 2y/5y/7y Notes and a short FRN. The market will maintain its attention on any Covid-19 and legislative developments this week, while also paying a close mind to fresh economic news.
Advance Special Offering: Symmetrical Prepayment Advance feature —Please contact your Relationship Manager at
212-441-6700 or the Member Services Desk at 212-441-6600 for information.
New Product Alert: In order to satisfy member needs and provide greater product flexibility to match bond and derivative market conventions, FHLB-NY now offers SOFR-linked advances based on SOFR-index compounding. Note that this product is in addition to SOFR-linked advances based on SOFR-index averaging which have been offered since November 2018.
The Symmetrical Prepayment Advance Feature
With rates at or near multi-year lows, it is a compelling juncture to use the SPA feature on term advances. This feature allows member to capture, at prepayment, changes in the Fair Value of the advance which are favorable to the member. Contact us to discuss.
Looking for more information on the above topics? We’d love to speak with you!
Questions?
If you wish to receive the MSD Weekly Market Update in .pdf format (includes FHLBNY rate charts) or to discuss this content further, please email the
MSD Team.
Special Member Alert
The FHLBNY recently announced a newly expanded and flexible Disaster Relief Funding (DRF) advance program which offers discounted rate advances with maturities 1-mo and greater. Additionally, we have announced that PPP loans will be accepted as eligible collateral. Please contact us with any questions.