Member Services Desk
Weekly Market Update
This MSD Weekly Market Update reflects information for the week of November 14, 2022.
Economist Views
Click to expand the below image.
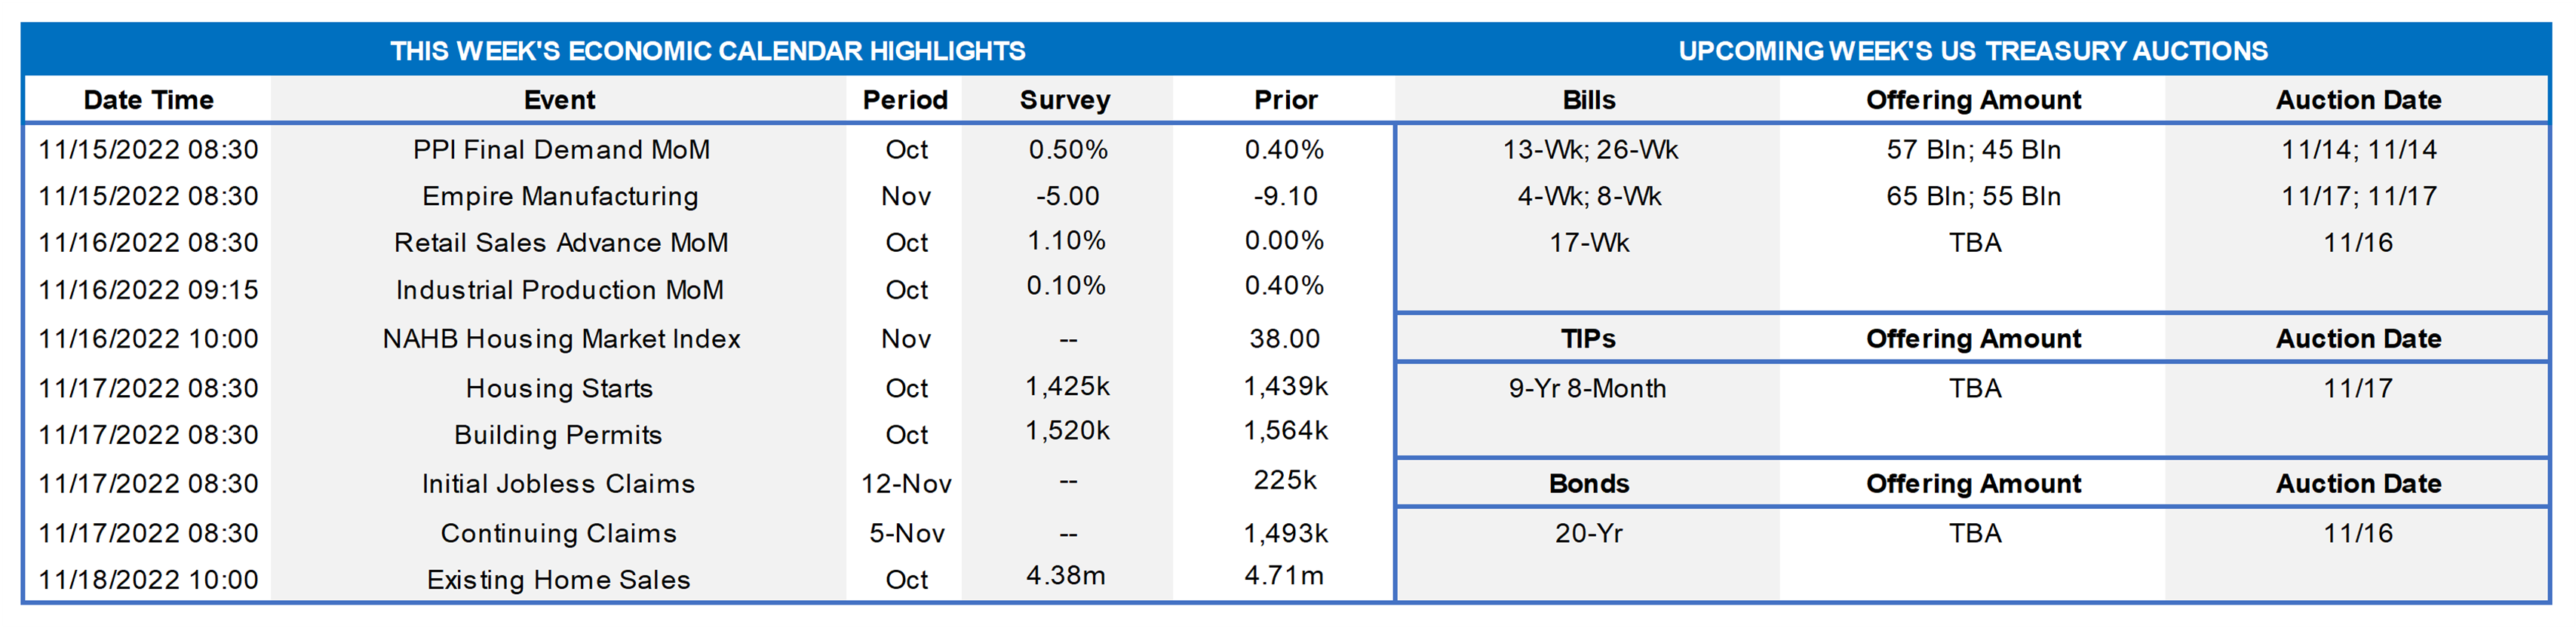
The market will digest a heavy slate of economic data this week, most of which will provide important insight into the pace of current-quarter activity. Retail sales likely posted a solid gain in October, while stepped-up factory output pushed industrial production higher. Unusually favorable weather conditions last month hint at a potential positive surprise on the residential construction front. Weekly jobless claims are expected to remain in recent ranges. While the median Street forecast currently calls for a modest .6% annualized increase in real GDP during Q4, more robust tracking estimates, such as that of the Atlanta Fed, place the pace of inflation-adjusted business activity at a heady 4%. Fed officials will be active in providing views on a variety of timely topics.
Producer Prices: Powered by an anticipated pickup in wholesale energy costs, the Producer Price Index (PPI) for final demand likely climbed by .5% in October, after a 0.4% increase in the prior month. That projection, if realized, would leave the headline PPI 8.4% above the level recorded a year ago.
Empire State Manufacturing Survey: The contraction manufacturing activity in New York State probably entered its fourth month in November, although the extent of the anticipated decline likely narrowed from October. The net percentage of respondents experiencing a falloff in business during the reference period is expected to improve to -5% from -9.1% in the previous month.
Retail & Food Services Sales: An anticipated sharp rebound in auto-dealer revenues, combined with a price-induced rise in gas station receipts, probably propelled retail and food services sales 1.1% higher in October – the largest gain since March. Market participants will pay particular focus to so-called control sales excluding auto, building materials, and gas purchases in the report. Barring any prior-month revisions, the .3% uptick anticipated by the Street would place core purchases last month 2.3% annualized above their July-September average.
Industrial Production & Capacity Utilization: A tug of war between a modest increase in manufacturing output and a weather-related decline in utilities generation probably left this gauge .1% higher in October, after a .4% gain in the previous month. With additions to productive capacity expected to eclipse output during the reference period, the overall operating rate probably edged one tick higher to 80.4% – the highest level since March 2008.
NAHB Housing Market Index: With little to buoy members’ spirits, the National Association of Home Builder’s sentiment gauge probably remained at a historically depressed level in November.
Housing Starts & Building Permits: Unusually warm and dry weather conditions suggest that both housing starts and building permits could surprise to the upside in the October report.
Jobless Claims: New claims for unemployment insurance benefits likely remained in a historically low 210-230K range during the week ended November 12. Pay particular attention to continuing claims in the upcoming report for any clues that recently furloughed employees are having a more difficult time finding work.
Existing Home Sales: Home-purchase contract signings over the August-September span suggest that closings tumbled by 5.7% to a SAAR of 4.44mn in October – the weakest showing since the pandemic low of 4.07mn posted in May 2020. With the number of homes on the market expected to dip by an estimated 2.4% to 1.22mn during the reference period, the stock of available dwellings likely clocked in at 3.3 months’ supply.
Federal Reserve Appearances:
- Nov. 14 New York Fed President Williams to participate in a panel discussion at the Economic Club of New York.
- Nov. 15 Fed Vice Chair for Supervision Michael Barr to testify before the Senate banking Committee.
- Nov. 17 St. Louis Fed President Bullard to discuss the economic and policy outlook at an event in Louisville, Kentucky.
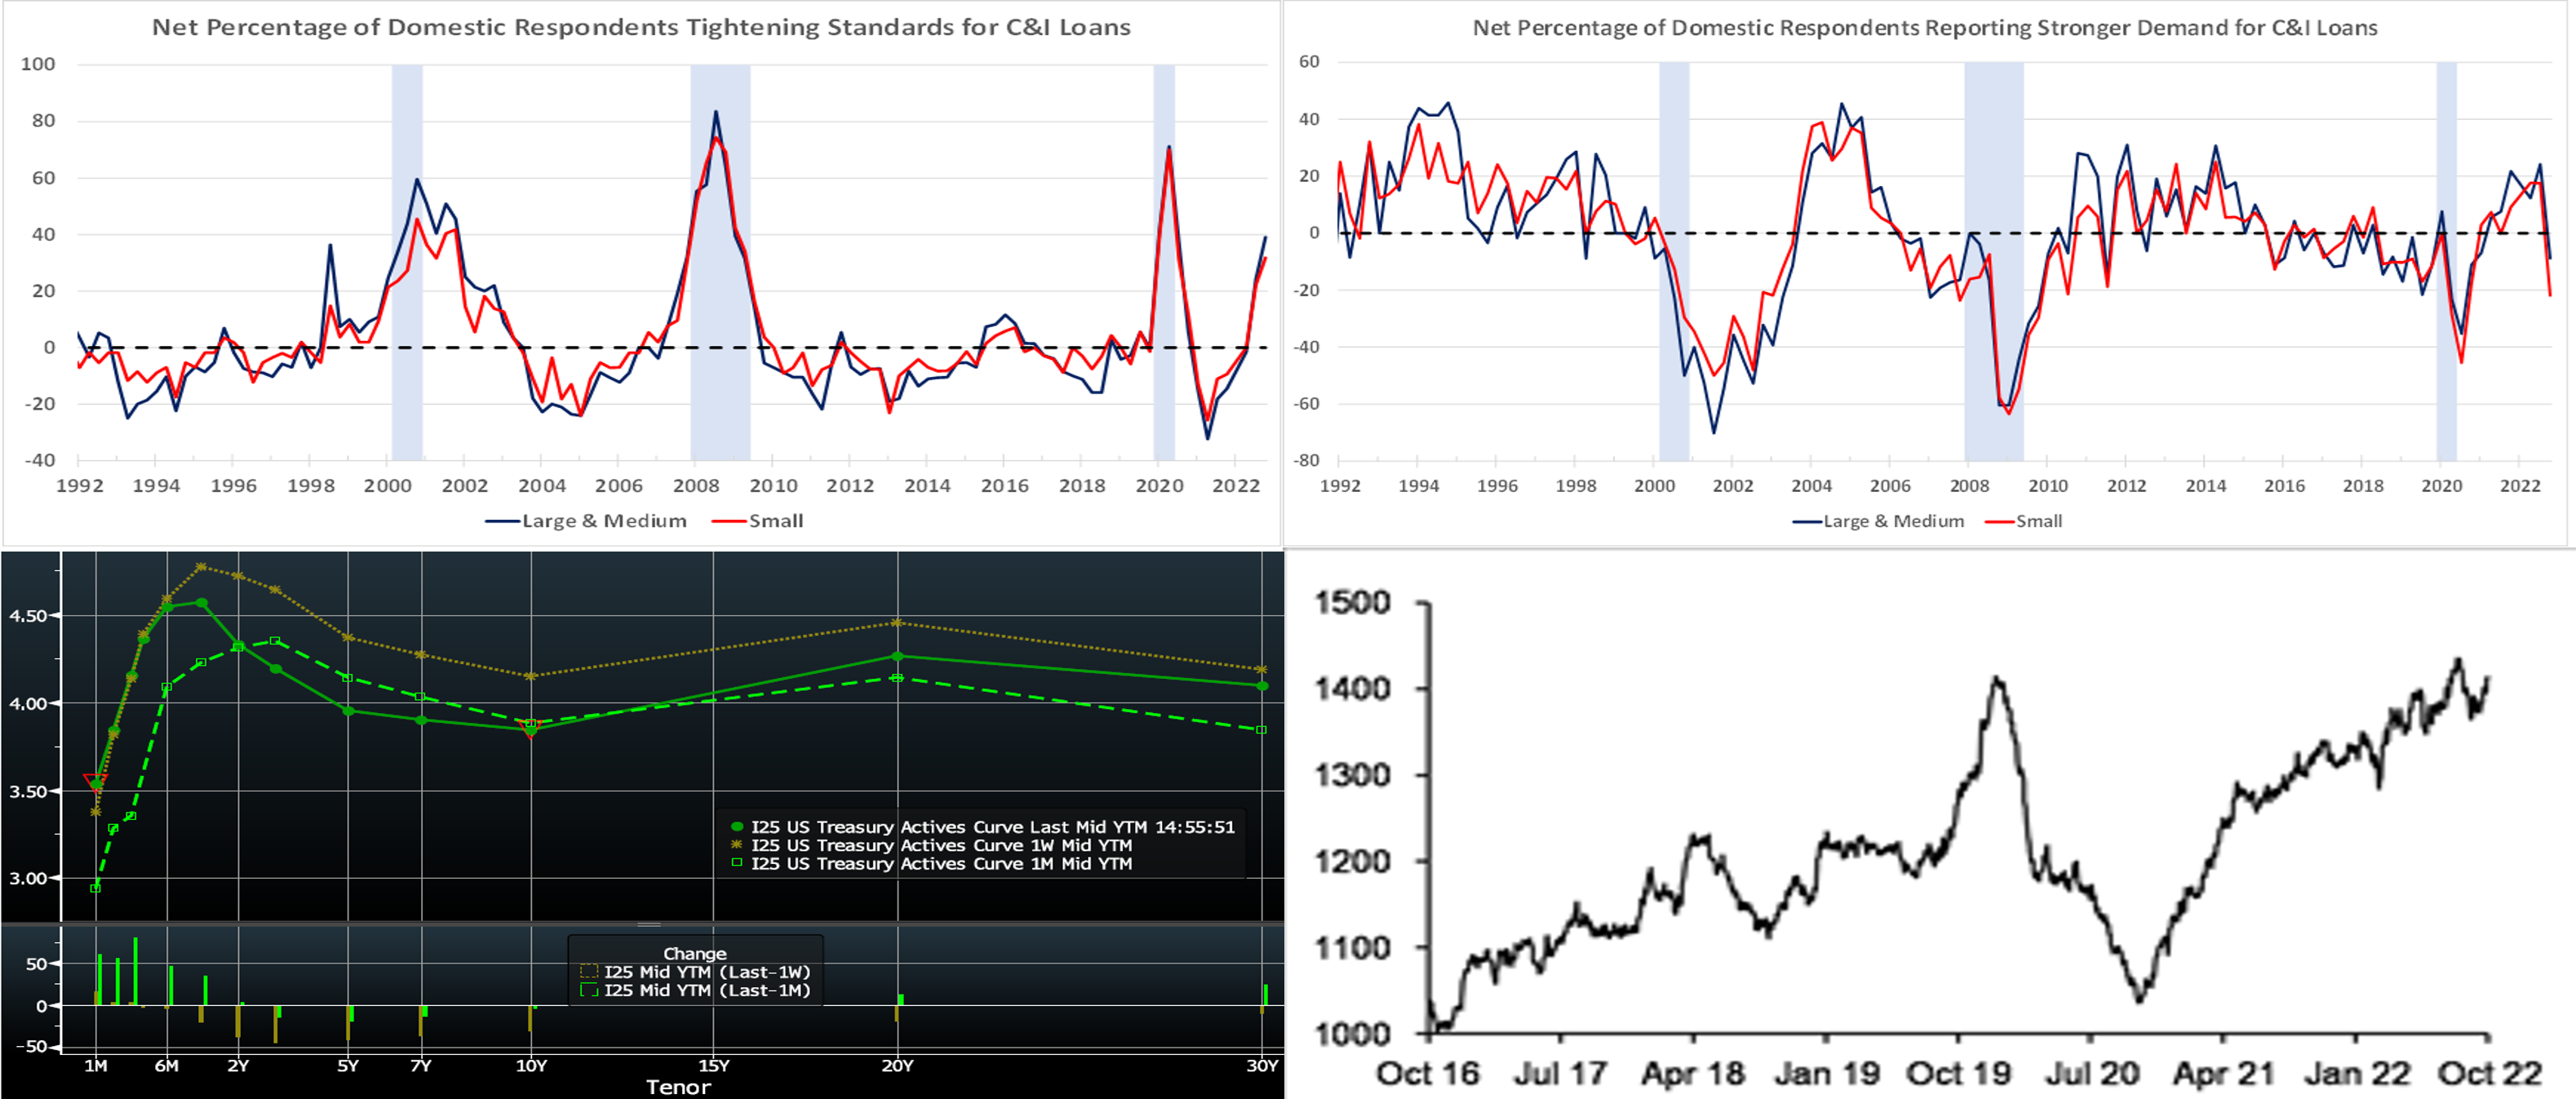
CHART 1 UPPER LEFT
Source: Board of Governors of Federal Reserve; FHLB-NY. Notes: Blue-shaded area denotes recessions. The Federal Reserve Board’s October 2022 Senior Loan Officer Opinion Survey on Bank Lending Practices revealed a general tightening of standards across virtually all loan categories during the summer quarter. The net percentages of loan officers reporting tighter lending standards for Commercial & Industrial (C&I) loans to large, medium, and small firms clocked in at 39.1% and 31.8%, respectively, during the reference period. These results marked the broadest firming, as seen here, in practices since the spring of 2020.
CHART 2 UPPER RIGHT
Source: Board of Governors of Federal Reserve; FHLB-NY. Notes: Blue-shaded area denotes recessions. Meanwhile, also revealed in the Senior Loan Officer Survey, was that the diffusion of demand for loans from large and medium companies contracted sharply in the latest canvass, tumbling to -8.8% from 24.2% in July – the first reading in contractionary territory in 18 months. Demand for loans from smaller firms declined even more sharply during the reference period from 17.5% in July to -21.9%.
CHART 3 LOWER LEFT
Source: Bloomberg. Note: Top pane is yield (%), bottom pane is change (bps). UST term yields, as of late Thursday, were markedly lower from the week prior and are also now a bit lower, in the 3 to 10-year sector, than levels of a month ago. The catalyst for the move was Thursday morning’s lower-than-expectations CPI (consumer price inflation) report. The report instigated a dramatic rise in stocks and decline in yields, with the market notably adjusting downwards its Fed-hike pricing. The ~30 bps decline in the 5-year yield was the biggest single-day dip since March 2009! The market now prices for a ~100% chance of a 50 bps hike at the December 14th FOMC but with now 0%, down from last week’s 30%, probability of a 75 bps hike. Moreover, the peak funds rate in spring 2023 last stands at ~4.88%, down from last week’s 5.15%. Basically, markets priced for a deceleration in the scale of Fed hikes. In turn, several FOMC members “pushed back” against the market’s exuberance via comments to the effect that the Fed’s work was far from done. In this light, there could be increased volatility ahead. We continue to encourage members to engage with the desk for rate updates and product information, especially since our advance rates dynamically move with market rates.
CHART 4 LOWER RIGHT
Source: DTCC; JP Morgan. Shown here are bank Commercial Paper (CP) and Certificates of Deposit (CD) outstanding principal amounts (LHS, $bn). Current outstanding amounts are near their highest levels since late-2019. As we noted and charted in last week’s edition, funding spreads over the turn-of-the-year have widened in the past two months. Money-market investors have been intent on keeping duration short, as witnessed by high balances in the Fed’s RRP. And Government-only Money Market Funds (MMF) cannot invest in bank CP/CD’s, thereby removing that sector as a source of demand to meet the supply surge. Members may wish to address funding and liquidity needs sooner than later, given this backdrop, and compare our “all-in” (including dividend impact) advance levels and maturity flexibility to alternative funding sources. For further information on “all-in” advance rates, including access to a calculator tool, please contact us.
FHLBNY Advance Rates Observations
Front-End Rates
- Short-end rates generally finished a few bps lower week-over-week, spurred in part by the changes in the market’s pricing of Fed hikes; please see the prior slide for more details. Economic data and Fed-speak will provide further direction to rates this week.
- Given the Fed’s tightening and data-dependent posture, rates will remain highly responsive to the Fed and economic data. Post this past week’s CPI release, the retail sales release should be the highlight of the week data-wise.
Term Rates
- The longer-term curve finished notably lower from the week prior, with the 3 to 5-year leading the move and generally mirroring the direction in UST and swaps markets. While 2-year was ~38 bps lower, the 3-year was ~45 bps lower and 5-year finished down by ~41 bps. Kindly refer to the previous section for relevant market color. The advance curve remains inverted out to 5-year, thereby offering opportunities to extend in advance duration for minimal or lower coupon cost. The flat curve and high implied volatility environment also can serve to make putable advances more compelling.
- On the UST term supply front, this upcoming offers a 20-year nominal and 10-year TIPS auction. Market focus will steer towards the plethora of Fed-speak in the coming days. Please call the desk for information on market dynamics, rate levels, or products.
Product Alert: FHLBNY is pleased to announce the reintroduction, after a temporary suspension owing to Libor-cessation, of the Putable Advance, Fixed-Rate with SOFR Cap Advance, and ARC with SOFR Cap/Floor Advance. The Callable Advance continues to be offered. This expansion of the product menu will provide members with more options and flexibility for the management of funding and/or hedging needs.
Forward Start Advance (FSA): For members with upcoming borrowing or refunding plans, consider the FSA as a method to opportunistically “lock in” rates before advance settlement date.
Please call the Member Services Desk at (212) 441-6600 for more information.
The Symmetrical Prepayment Advance Feature
For those anticipating term funding needs, and with rates on an uptrend, it can be an appropriate juncture to consider our SPA feature. This feature allows the member to capture, at prepayment, changes in the fair value of the advance which are favorable to the member. Contact the Member Services Desk to discuss.
Looking for more information on the above topics? We’d love to speak with you!
Questions?
If you wish to receive the MSD Weekly Market Update in .pdf format (includes FHLBNY rate charts) or to discuss this content further, please email the MSD Team.