Member Services Desk
Weekly Market Update
This MSD Weekly Market Update reflects information for the week of July 18, 2022.
Economist Views
Click to expand the below image.
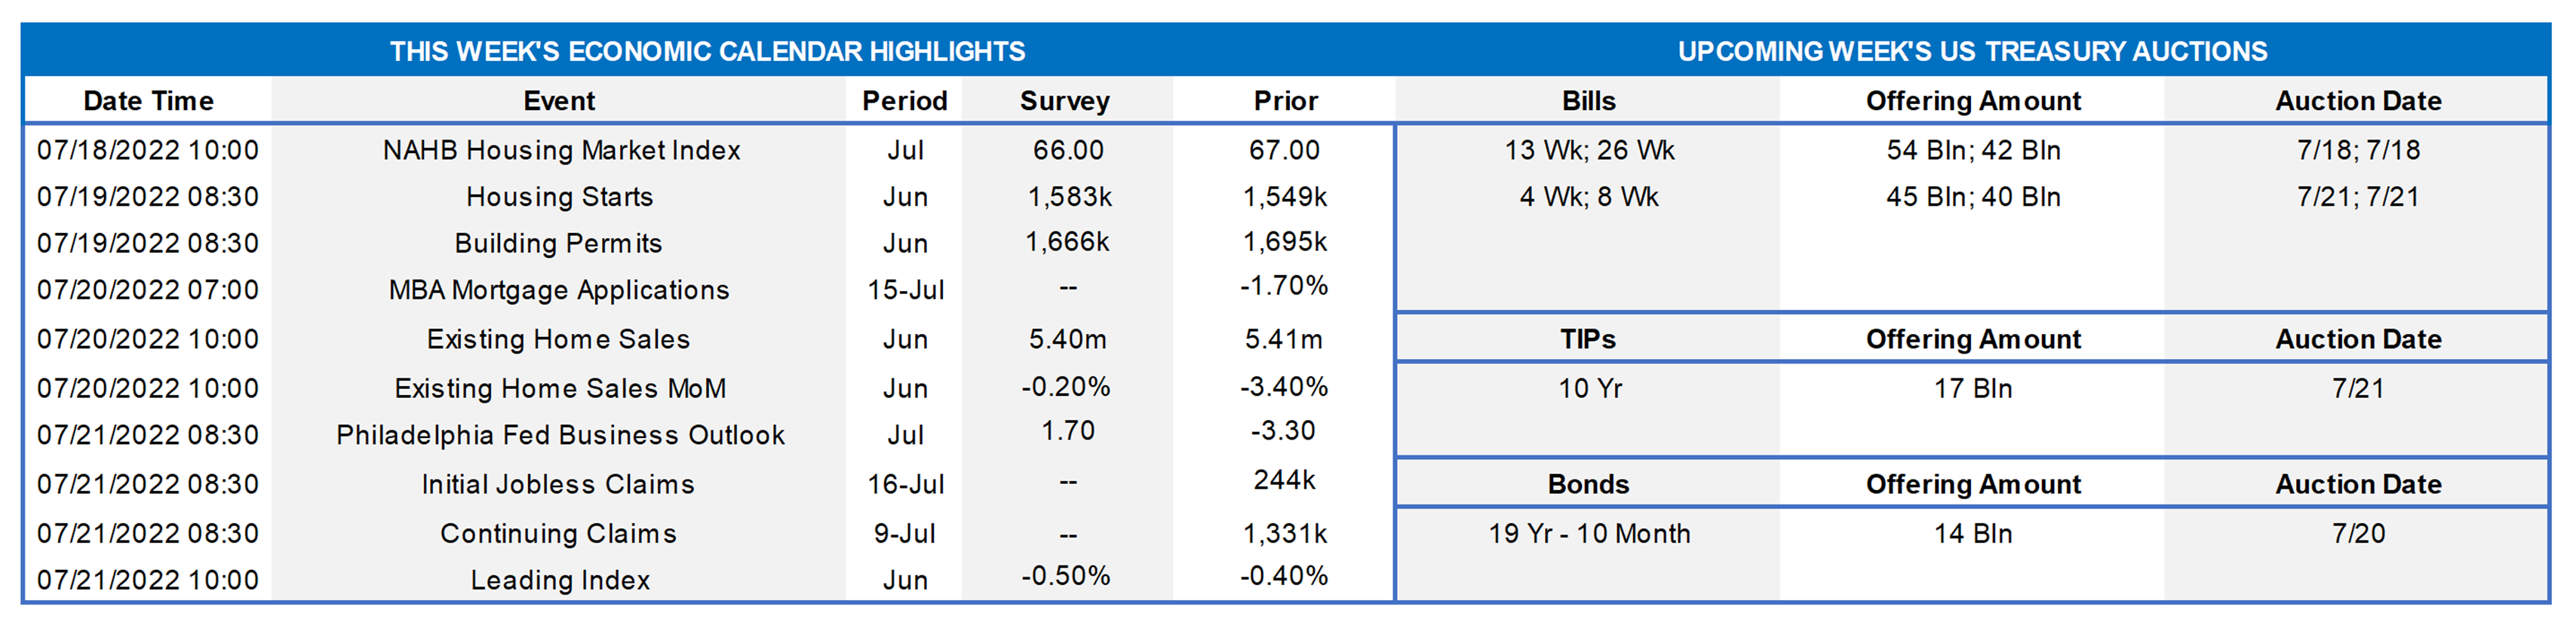
With Federal Reserve officials observing the traditional blackout period ahead of the July 26-27 Federal Open Market Committee meeting, market participants will be left to their own devices in guessing the size of the upcoming increase in the federal funds target range from the current 1.5-1.75% band. On the data front, traders and investors will receive a trio of housing-related reports to digest. The Department of Labor’s update on jobless claims will provide insight on the impact of monetary tightening to date on labor-market conditions. With fears of recession rising almost daily, the Index of Leading Economic Indicators may receive an unusually high degree of attention in a comparatively quiet week.
NAHB Housing Market Index: Demand and supply-side challenges likely weighed on home-builder sentiment in July. The Street expects the NAHB Housing Market Index to dip by one point to a three-year low of 66. However, press reports of widespread home-purchase cancellations suggest that a larger decline might be in store in the upcoming report.
Housing Starts & Building Permits: Buoyed by unusually favorable weather conditions, the number of residential housing units started and building permits issued probably rebounded last month, following the outsized declines recorded in May. Responding to the dearth of available dwellings on the market, the number of housing units under construction but not yet completed likely climbed to a new record high.
Existing Home Sales: The falloff in home-purchase contract signings over the April-May span suggests that closings declined by 1.1% to a two-year low seasonally adjusted annual rate of 5.35mn in June. With the number of homes on the market expected to rise by an estimated 1.7% to 1.18mn during the reference, the stock of available dwellings likely clocked in at 2.6 months’ supply.
Philadelphia Business Outlook Survey: Manufacturing activity in the Philadelphia Federal Reserve Bank district probably expanded marginally in July, following a similarly modest contraction in the previous month.
Jobless Claims: The Department of Labor’s weekly tally of new unemployment insurance claims should be watched closely for signs that labor demand is slowing in response to the Federal Reserve’s aggressive tightening of monetary policy.
Index of Leading Economic Indicators: Adding to recession concerns, the Conference Board’s barometer of prospective economic activity is expected to fall by .5% in June, marking its fourth consecutive monthly decline.
Federal Reserve Appearances: None. Federal Reserve officials will be observing the blackout period ahead of the July 26-27 FOMC meeting.
Click to expand the below image.
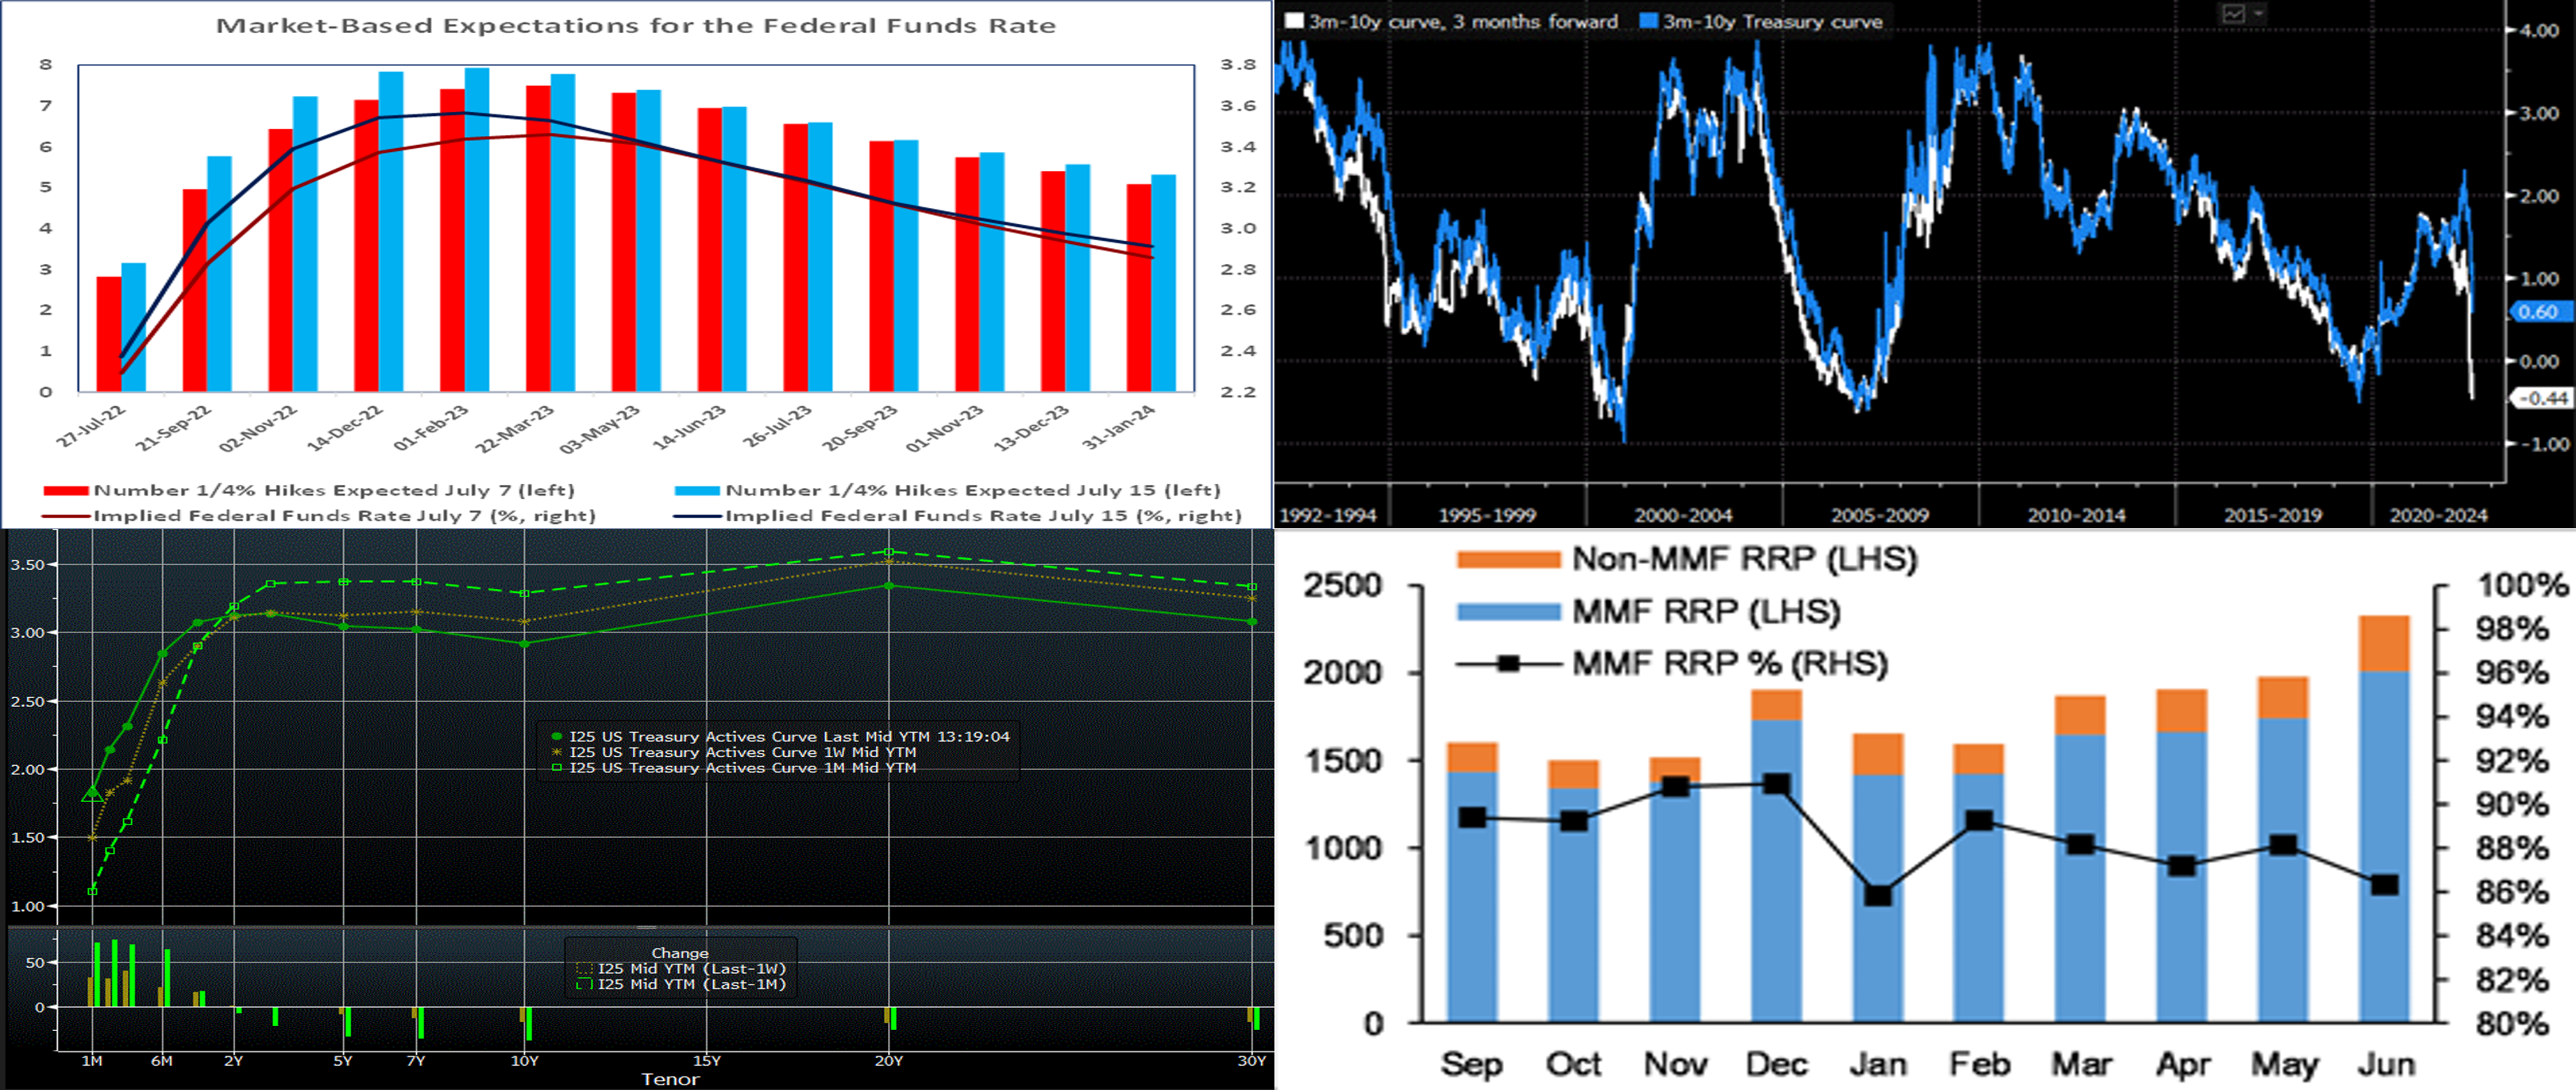
CHART 1 UPPER LEFT
Source: Bloomberg; FHLBNY. Market-based expectations of prospective Fed interest rate increases have moved materially higher in the wake of the employment and consumer price reports for June. Traders and investors now price full certainty of a 75 bps hike in the federal funds rate target range to 2.25-2.5% at next week’s FOMC meeting, with the chance of a 100 bps hike at almost 18%. It should be noted that, on Wednesday morning post the CPI release, this probability of a 100 bps hike was priced ~80%; subsequent Fed member comments and data releases, however, served to trim the odds. In contrast to Fed officials’ call for additional rate hikes in 2023 contained in the “dot plot” released after the June meeting, market participants expect the current tightening cycle to end next March, implying a view that the Fed will be successful in containing inflation or risk pushing the economy into recession.
CHART 2 UPPER RIGHT
Source: Bloomberg. Shown here is the UST 3-month/10-year “spot” (Blue, RHS, %) and “3-month forward” curve (White, RHS, %). Markets are pricing a 3mo/10yr inversion within a matter of weeks, as the 3-month tenor will “ride up” the curve of anticipated Fed hikes, while longer tenors remain more stable. Why is this relevant or notable? Federal Reserve research has cited this curve sector, rather than the more frequently media-cited 2-year/10-year slope, as a potentially superior recession indicator for 12-month time periods ahead. As evident in the chart, this curve slope dipped to inverted levels prior to past recessionary episodes. As noted in last week’s edition, such indicators and other market strategist prognostications can be subject to change; at this juncture, most strategists expect any potential recession to be of a short and mild variety. Lastly, the current flat/inverted yield curve also may reflect the market’s belief that the Fed will succeed in corralling inflationary forces; indeed, this past Friday’s University of Michigan measure of consumer long-term inflation expectations fell to 2.8%, the lowest in a year and down from 3.1% last month.
CHART 3 LOWER LEFT
Source: Bloomberg. Note: Top pane is yield (%), bottom pane is change (bps). The yield curve finished the past week notably flatter from both a week and a month ago. Very-short maturities continue to rise, as they cross further past and into the Fed hiking cycle timeline. Tenors 2-year and out were flatter but not as changed on the week, with 2-year a few bps higher, 5-year ~7 bps lower, and 10-year ~15 bps lower. Yields had been higher mid-week, post the higher-than-expected CPI release, a Bank of Canada 100 bps hike, and a Fed member declaring that “everything is in play” for the upcoming FOMC. Subsequent Fed-speak and data downgraded the odds of a 100 bps hike, however, and yields subsided from the week’s highs. With the Fed now in blackout mode, the focus will be on the week’s data.
CHART 4 LOWER RIGHT
Source: JP Morgan. Portrayed here is MMF (Money Market Fund) RRP (Fed’s Reverse Repo Program) and non-MMF RRP balances (LHS, $bn) versus MMF RRP share (RHS, %) of the total RRP balance. MMFs continue to deploy large sums to the RRP, as the RRP, at 1.55%, has been yielding more than other short-term alternatives. This trend has likely persisted and increased this month, as MMFs have sought to significantly decrease their WAMs (weighted average maturities) ahead of potentially larger-than-expected Fed hikes. These dynamics in the front-end of the curve have served to spur moves in the short-end market and advance rates. We highly encourage our readers to engage with us to monitor intraday moves.
FHLBNY Advance Rates Observations
Front-End Rates
- Short-end Advance rates finished notably higher week-on-week, with 1-month up 51 bps and 6-month up 34 bps. Short-end markets remain volatile, thereby leading to some dynamic moves in rates both day-to-day and intraday. While there are large amounts of cash chasing limited supply in the front-end, the pricing of Fed hikes continues to pressure yields higher. As of this past Friday midday, the market priced for a 100% chance of another 75 bps, and ~18% chance of a 100 bps, hike for the July 27th FOMC. And then a 50 bps, with ~40% chance of another 75 bps, hike is priced for the Sept. 21st FOMC. This pricing, and the fact that maturities are crossing further into the timeline of the Fed hiking cycle, contributed to the rate moves.
- Given the Fed tightening posture and upcoming FOMC meetings, rates will remain highly responsive to the market’s moves and pricing of the Fed.
Term Rates
- The longer-term curve finished notably flatter week-over-week, generally mirroring the move in UST and swaps markets. While the 1 and 2-year were ~11 and 2 bps higher, respectively, 5-year finished ~8 and 10-year ~18 bps lower from the week prior. Kindly refer to the previous section for relevant market color. The curve is extremely flat and even inverted at various points, thereby offering opportunities to extend in advance duration for minimal, if any (and, at some points, potentially less), coupon cost.
- On the UST term supply front, this upcoming week contains a 20-year nominal and a 10-year TIPS auction. The focus will be on this week’s data releases, given that the Fed will be in blackout mode. The market is likely to remain volatile. Please call the desk for information on market dynamics, rate levels, or products.
Product Alert: FHLBNY is pleased to announce enhancements to our Advance Rebate Program, which provides members an opportunity to receive a cash rebate when prepaying an eligible advance and rebooking a new advance within a 30-day period. Rebate-eligible advances now must have a minimum of 6-months (reduced from 1-year) remaining. Moreover, the potential cash rebate has been increased. This program can be suitable for those wishing to extend their liability duration and/or potentially improve net interest margin. Please call the Member Service Desk at (212) 441-6600 for more information.
Forward Start Advance (FSA): For members with upcoming borrowing or refunding plans, consider the FSA as a method to opportunistically “lock in” rates before advance settlement date. Please call the Member Service Desk at (212) 441-6600 for more information.
The Symmetrical Prepayment Advance Feature
With rates at or near multi-year lows, it is a compelling juncture to use the SPA feature on term advances. This feature allows member to capture, at prepayment, changes in the Fair Value of the advance which are favorable to the member. Contact us to discuss.
Looking for more information on the above topics? We’d love to speak with you!
Questions?
If you wish to receive the MSD Weekly Market Update in .pdf format (includes FHLBNY rate charts) or to discuss this content further, please email the MSD Team.