Member Services Desk
Weekly Market Update
Economist Views
Click to expand the below image.
Ripping another page from their calendars, market participants will contend with a hectic economic release calendar this week. The upcoming releases are expected to be universally upbeat, reinforcing expectations of an acceleration in real GDP growth during the current quarter from the winter’s 6.4% annualized pace. Federal Reserve officials will make half a dozen public appearances, with most talks focusing on the economic outlook and monetary policy. The Federal Reserve will also issue its latest Financial Stability Report.
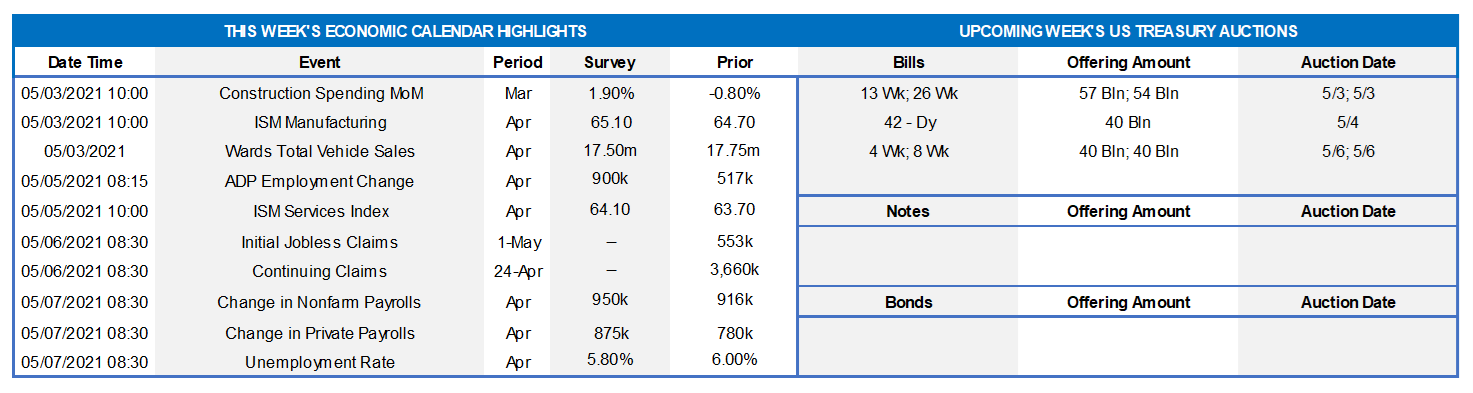
Construction Spending: The nominal value of new construction put-in-place is expected to have climbed by 1.8% in March, more than offsetting the weather-induced .8% decline posted in February.
ISM Manufacturing Purchasing Managers Index: Available district Federal Reserve Bank canvasses suggest that the Institute for Supply Management’s (ISM) factory activity gauge moved one percentage point higher to 65.7% – the highest reading since the 69.9% recorded in December 1983.
Unit Motor Vehicle Sales: Buoyed by stimulus checks remitted following passage of the American Rescue Plan Act, unit motor vehicle purchases probably moved above a seasonally adjusted annual rate of 18mn for the first time since September 2017.
ADP National Employment Report: ADP Employer Service’s update on private sector hiring in April may color expectations going into the official government report on Friday. Reported reductions in both initial and continuing jobless claims since the March canvassing period point to a 650K leap in private payrolls in April, eclipsing the 517K prior-month jump.
ISM Services PMI: District Federal Reserve Bank surveys hint that the ISM’s service-producing activity barometer probably moved deeper into record territory in April, climbing to 66.5% from 63.7% in March.
Employment Situation Report: The Bureau of Labor Statistics’ update on the employment situation in April will be the marquee statistical event of the week. Payroll employment growth is expected to have accelerated slightly, with the consensus anticipating a hefty 950K net new positions to be added after March’s solid 916K gain. The steady decline in the state insured unemployment rate between the March and April canvassing periods hints that the civilian jobless rate may have fallen to 5.7% from the 6.0% posted in the prior report. With the bulk of hiring likely to be concentrated once again in lower-paid, service-producing segments, average hourly earnings probably were unchanged, after a .1% dip in March.
Federal Reserve Appearances:
May 3: Fed Chair Powell to speak at a virtual event hosted by the National Community Reinvestment Coalition.
May 3: San Francisco Fed President Daly to take part in a virtual Q&A hosted by the Economic Club of Minnesota.
May 5: Chicago Fed President Evans to speak about the economy and monetary policy at event sponsored by Bard College.
May 5: Cleveland Fed President Mester to give virtual speech on economic outlook to the Boston Economic Club.
May 6: Dallas Fed President Kaplan to take part in a moderated Q&A session hosted by Bard College.
May 6: Cleveland Fed President Mester to take part in a virtual conversation sponsored by UC Santa Barbara.
May 6: Federal Reserve to release May 2021 Financial Stability Report.
Click to expand the below images.
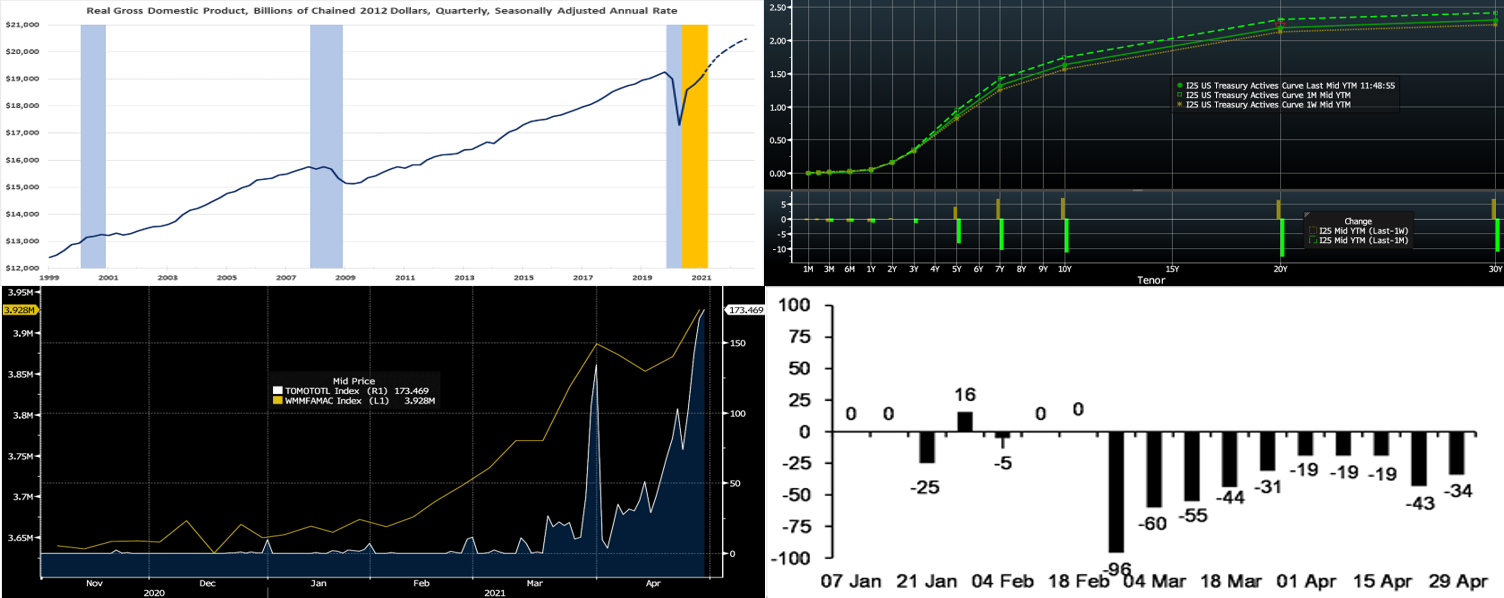
CHART 1 – UPPER LEFT
Source: Bloomberg, BEA, FRB St. Louis, NBER, FHLBNY; blue-shaded areas mark recessions, orange-shaded area marks past year when the probability of being in recession dipped below 1%. The dotted line denotes median consensus expectations. Real GDP expanded at an annualized pace of 6.4% in Q-1, up from the 4.3% clip of Q-4 2020. Given the wide range of estimates, the result was roughly in line with the 6.7% consensus forecast. Accelerating sharply to 10.7% annualized, real consumer spending accounted for an outsized chunk of the increase in topline growth. Business investment, housing, and government spending also made solid positive contributions. Reduced stock building, combined with a wider trade deficit, were negative contributors. Excluding the drawdown in business inventories during the reference period, real final sales of domestic product jumped by 9.2% annualized, up from 2.9% in Q-4 2020. The overall result left the level of inflation-adjusted GDP ~0.9% shy of its pre-pandemic level. Given a forecast of a further pickup in real GDP growth to 8.1% annualized in Q-2, economic activity should soon best that level and return to its long-term trendline by Q-4 2021.
CHART 2 – UPPER RIGHT
Source: Bloomberg. Note: top pane is yield (%), bottom pane is change (bps). UST yields the past week essentially reversed their week-prior move. While shorter maturities were barely changed, the curve 5-year and beyond finished 3 to 7 bps higher in steepening fashion. The FOMC reiterated its patient stance, with no meaningful news regarding a tapering of its asset purchases or on a timeline of rate tightening. This result served to pin shorter maturity yields. Meanwhile, strong corporate earnings and economic data, particularly Thursday’s GDP report, served to push longer yields a bit higher. But with the Fed as well as foreign and real-money investor buying, the curve has become rangebound; indeed, per the chart, the current curve sits in between that of a month ago and that of the prior week. While Covid-19 variants and some vaccine obstacles persist, the thus-far vaccination drive continues to foster economic activity and bolster growth projections which, in turn, are likely to underpin the yield curve. The market will monitor the upcoming week’s jobs data for further fresh clues on the economic recovery trajectory.
CHART 3 – LOWER LEFT
Source: Bloomberg. A few weeks back we portrayed the declining balance of the US Treasury’s General Account (“TGA”) and cited its downward impact on short-end rates as cash enters the banking system. Depicted here is the Fed’s Reverse Repurchase Program (“RRP”) facility (RHS, $bn) and the AUM of Government-Only Money Market Funds (LHS, $mn). The former, paying a rate of 0%, has ramped up markedly in recent weeks. And the Fed, in its effort to manage rates, has expanded the program’s participation guidelines. Meanwhile, money market AUM has surged higher in recent months. The high liquidity levels in the market have driven T-bill yields to 0%, and so it is no wonder that the RRP has experienced increased participation.
CHART 4 – LOWER RIGHT
Source: JP Morgan, US Treasury. Part of the downward pressure on short-end rates has been a supply-demand imbalance. Seen here is the weekly net issuance of T-bills ($bn, the latest $34bn is an estimate). While issuance may increase again owing to new fiscal bills/spending, the recent situation of negative net issuance continues to compress the short-end rates complex.
FHLBNY Advance Rates Observations
Front-End Rates
Short-end advance rates finished flat to a bp lower week-over-week. Money Market Funds’ AUM increased by a massive ~$60bn on the week, led by a $57bn increase in Government-Only funds, thereby infusing demand to the sector. The GSEs are also placing larger sums into money markets. And the US TGA continues its decline. From a bigger-picture vantage point, the overall moderation in the supply of short paper, relative to high cash levels in the market, is expected to keep short-end rates relatively steady and under downward pressure in the year’s first half.
UST issuance overall is now net positive supply in that more is being issued than what the Fed is buying in its programs. However, with short UST rates at rock-bottom levels and the Fed on hold for a long period, rates are likely to persist in a near-term sideways to softer pattern. Importantly, weekly net T-bill issuance has been lower since 2020 and even negative in recent months (see prior slide for further information), and Treasury has announced plans to shift issuance out the curve. The latest relief package and related borrowing may lead to an increase of T-bill auction sizes and positive net supply, but overall market supply/demand dynamics should keep short rates in check on the upside.
Term Rates
On the week, medium and longer-term Advance rates were flat to modestly higher 4-year and shorter while roughly 3 to 7 bps higher, in progressive fashion, 5-year and longer. Kindly refer to the previous section for further color on relevant market dynamics.
On the UST supply front, this week brings a reprieve in auctions. The market will maintain its attention on further Covid-19 and legislative developments this week, while also paying a close mind to the week’s employment data releases.
Advance Special Offering: Symmetrical Prepayment Advance feature —Please contact your Relationship Manager at
212-441-6700 or the Member Services Desk at 212-441-6600 for information.
New Product Alert: In order to satisfy member needs and provide greater product flexibility to match bond and derivative market conventions, FHLB-NY now offers SOFR-linked advances based on SOFR-index compounding. Note that this product is in addition to SOFR-linked advances based on SOFR-index averaging which have been offered since November 2018.
The Symmetrical Prepayment Advance Feature
With rates at or near multi-year lows, it is a compelling juncture to use the SPA feature on term advances. This feature allows member to capture, at prepayment, changes in the Fair Value of the advance which are favorable to the member. Contact us to discuss.
Looking for more information on the above topics? We’d love to speak with you!
Questions?
If you wish to receive the MSD Weekly Market Update in .pdf format (includes FHLBNY rate charts) or to discuss this content further, please email the
MSD Team.
Special Member Alert
The FHLBNY recently announced a newly expanded and flexible Disaster Relief Funding (DRF) advance program which offers discounted rate advances with maturities 1-mo and greater. Additionally, we have announced that PPP loans will be accepted as eligible collateral. Please contact us with any questions.