Member Services Desk
Weekly Market Update
Economist Views
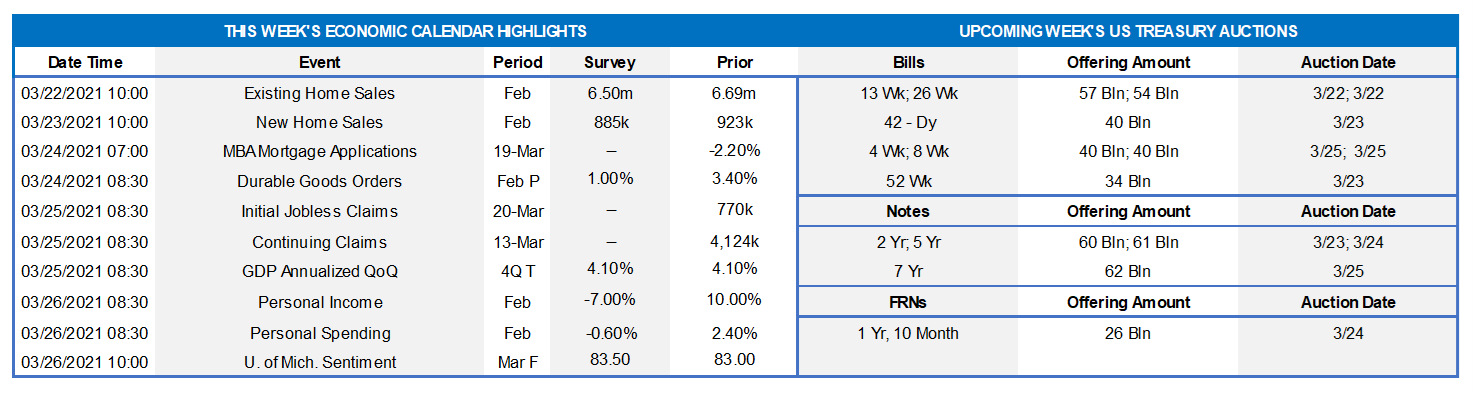
Existing Home Sales: A modest reduction in home-purchase contract signings over the December-January span suggests that existing home sales probably dipped by 1.6% to a SAAR of 6.58mn in February. With the number of dwellings on the market expected to climb by 50K to 1.09mn during the reference period, the months’ supply of unsold homes likely edged higher to 2.0 months.
New Home Sales: Inclement weather conditions across much of the country probably left new home sales 10.1% lower at a nine-month low seasonally adjusted annual rate of 830K in February.
Markit Manufacturing Purchasing Managers Index: Available soundings from district Fed Banks suggest that this gauge of national manufacturing activity improved on February’s 58.6% reading.
Jobless Claims: Initial and continuing claims under regular state unemployment insurance programs probably moved lower during their respective reporting periods. Those figures continue to understate the adverse impact of the pandemic and the slow healing of the domestic labor market, however. Indeed, as of February 27, an estimated 18.2mn persons were receiving some sort of unemployment assistance, down from the pandemic peak of 32.4mn reached last June but still well above the 2.1mn prevailing before COVID-19 struck last March.
Personal Income & Spending: Sans the massive lift from economic impact payments and increased unemployment insurance benefits made in January under the Coronavirus Response and Relief Supplemental Appropriations Act, personal income probably fell by 7% in February, reversing ~75% of the prior-month 10% gain. Severe weather conditions across much of the country last month likely triggered a .8% decline in nominal consumer spending, after a solid 2.4% start-of-the-year gain.
Federal Reserve Appearances:
Mar 22: Fed Chair Powell to take part in a virtual panel discussion sponsored by the BIS on central bank innovation.
Mar 22: Fed Vice Chair for Supervision Quarles to speak about LIBOR transition at a virtual SOFR symposium.
Mar 23: St. Louis Fed President Bullard to discuss the economy and monetary policy at a virtual event hosted by the LSE.
Mar 23: Fed Chair Powell and Treasury Secretary Yellen to appear before House Financial Services Committee on CARES Act.
Mar 23: Atlanta Fed President Bostic to record podcast on economic inclusivity.
Mar 23: New York Fed President Williams to take part in a virtual panel discussion on the central New York economy.
Mar 23: Fed Governor Brainard to discuss the economic outlook at National Association for Business Economics conference.
Mar 24: Fed Chair Powell and Treasury Secretary Yellen to take part in remote hearing before Senate Banking Committee.
Mar 24: New York Fed President Williams to take part in moderated discussion sponsored by Syracuse University and Onondaga Community College.
Mar 25: New York Fed President Williams to take part in a virtual discussion sponsored by The Urban Core of Syracuse.
Mar 25: Fed Vice Chair Clarida to discuss economic outlook and monetary policy at Institute of International Finance event.
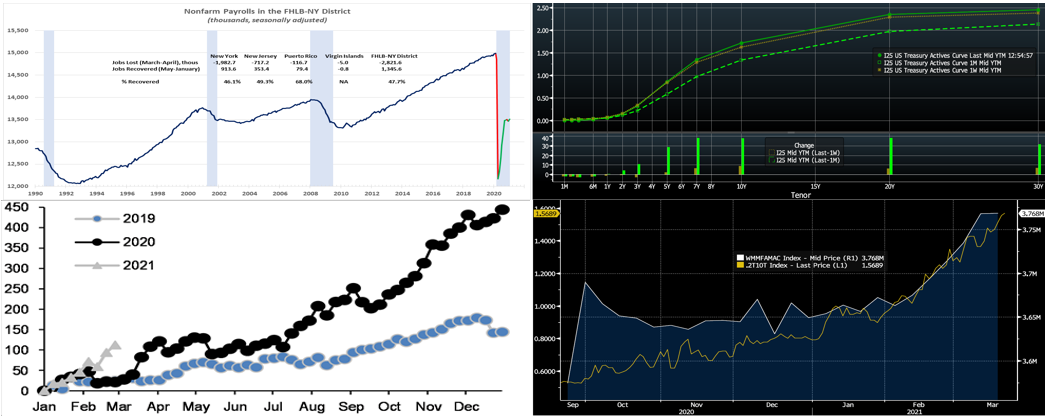
CHART 1 – UPPER LEFT
Source: BLS, FHLBNY. The BLS reported that nonfarm payrolls in our district expanded by 53K in January, more than offsetting the revised 40K (was 52K) December decline. The details of the report revealed that NY added 42.7K net new positions during the reference period, followed by 8.9K in PR, 900 in NJ, and 100 in the VI. Since last April, the District has recovered ~1.35mn, or 47.7%, of the 2.82mn jobs lost to the crisis, lagging the 55.9% nationwide recovery. The composition of employment in our area continues to constrain the local rebound. Many of the hardest hit segments, such as professional & business services, education & health, and leisure & hospitality have recouped less than half of the massive job losses suffered over the March-April 2020 span. Turning to the BLS’ household survey, the overall unemployment rate across NY, NJ, and PR (data unavailable for the VI) remained on a saw-toothed path, rising by two ticks to 8.6%, as 20K persons joined the labor force but another 1.7K were laid off. Jobless rates across the District at the beginning of 2021 remained well above the 6.3% national average.
CHART 2 – UPPER RIGHT
Source: Bloomberg. Note: top pane is yield (%), bottom pane is change (bps). The UST curve yet again pressed higher and steeper week-over-week. While shorter maturities finished generally unchanged, the 5 through 10-year sector was ~4 to 10 bps higher, in progressive fashion. The continued upward/steeper move in rates should prove welcome for many financial institutions’ net interest figures. The Covid-19 situation remains at concerning levels, but the notable upward trend in vaccinations has boosted economic optimism and projections. The American Rescue Plan legislation is now in effect, with relief/stimulus checks already reaching the public, thereby further provoking near-term upward adjustments to forecasts of both economic data and UST supply. The FOMC meeting this past week clearly portrayed a Fed that is “on hold” and not contemplating any tightening measures, either on asset purchases or rates, until actual conditions have met their goals of full employment; Chair Powell emphasized that the Fed will not act pre-emptively to “get ahead of” or stem near-term inflation signs. These dynamics continue to underpin the “bear steepening”.
CHART 3 – LOWER LEFT
Source: JP Morgan, Federal Reserve. Shown here is cumulative MBS purchases (in $bn, adjusted for price moves) by US banks since the start of the year in 2019, 2020, and 2021 according to the Fed’s H.8 report. Banks have added $110bn of MBS this year-to-date, outpacing the prior years. The recent “bear steepening” of the curve helps to make MBS a more attractive outlet to “put funds to work”. Until stronger loan growth resumes, and now with more attractive net interest income potential, MBS purchases by banks are likely to increase further.
CHART 4 – LOWER RIGHT
Source: Bloomberg. Short-term market rates have reached rock-bottom levels, with T-bills trading ~0% late-week. While multiple factors have contributed to the downward pressure on short rates, this chart reveals that a contributing dynamic in the past six weeks could be cash exiting longer maturity securities and being parked in the short-end of the curve. As seen here, Government-Only Money Market Funds’ AUM ($bn) has marched higher to ~$3.77trn in conjunction with the steepening of the UST 2-year/10-year curve.
FHLBNY Advance Rates Observations
Front-End Rates
Short-end advance rates finished 2 bps lower, week-over-week. Government-Only Money Market Funds’ AUM increased by ~$.35bn this past week; per color on the previous slide, this sector has infused demand for short paper in the past six weeks. Meanwhile, the GSEs have been placing larger sums into money markets, and this trend is typically magnified leading up to MBS coupon payments on the 25th of the month. From a bigger-picture vantage point, an overall moderation in the market supply of short paper, in tandem with high cash levels in the market, is expected to keep short-end rates relatively steady and under downward pressure in the year’s first half.
UST issuance overall is now net positive supply in that more is being issued than what the Fed is buying in its programs. However, with short UST rates at rock-bottom levels and the Fed on hold for a long period, rates are likely to persist in a near-term sideways to softer pattern. Importantly, weekly net T-bill issuance has been lower since last summer and even negative at times in recent weeks/months, and Treasury has announced plans to shift issuance out the curve. The new relief package and related borrowing may indeed lead to an increase of T-bill auction sizes, but overall market supply/demand dynamics should keep short rates in check on the upside. Notably, overnight GC repo again traded below 0% this past week. In a step to alleviate downward rate pressures, the Fed this past week announced an increase to the counterparty dollar amount limits in its Reverse Repurchase Program.
Term Rates
On the week, medium and longer-term Advance rates were unchanged in shorter tenors but ~2 to 8 bps higher 5-year and out, in progressive fashion. Kindly refer to the previous section for further color on relevant market dynamics.
On the UST supply front, this week brings UST 2/5/7-year auctions. Recent auction sizes have been of record size and another contributor to the curve’s moves, and so particularly the 5 and 7-year will be closely watched as a gauge of investor sentiment and as a signal of any potential pause in the curve’s “bear steepening”.
New Product Alert: In order to satisfy member needs and provide greater product flexibility to match bond and derivative market conventions, FHLB-NY now offers SOFR-linked advances based on SOFR-index compounding. Note that this product is in addition to SOFR-linked advances based on SOFR-index averaging which have been offered since November 2018.
The Symmetrical Prepayment Advance Feature
With rates at or near multi-year lows, it is a compelling juncture to use the SPA feature on term advances. This feature allows member to capture, at prepayment, changes in the Fair Value of the advance which are favorable to the member. Contact us to discuss.
Looking for more information on the above topics? We’d love to speak with you!
Questions?
If you wish to receive the MSD Weekly Market Update in .pdf format (includes FHLBNY rate charts) or to discuss this content further, please email the
MSD Team.
Special Member Alert
The FHLBNY recently announced a newly expanded and flexible Disaster Relief Funding (DRF) advance program which offers discounted rate advances with maturities 1-mo and greater. Additionally, we have announced that PPP loans will be accepted as eligible collateral. Please contact us with any questions.