Member Services Desk
Weekly Market Update
This MSD Weekly Market Update reflects information for the week ending November 3, 2023.
Economist Views
Click to expand the below image.
Please note that the information in this Update is prior to a potentially market-moving Friday, November 3rd employment report.
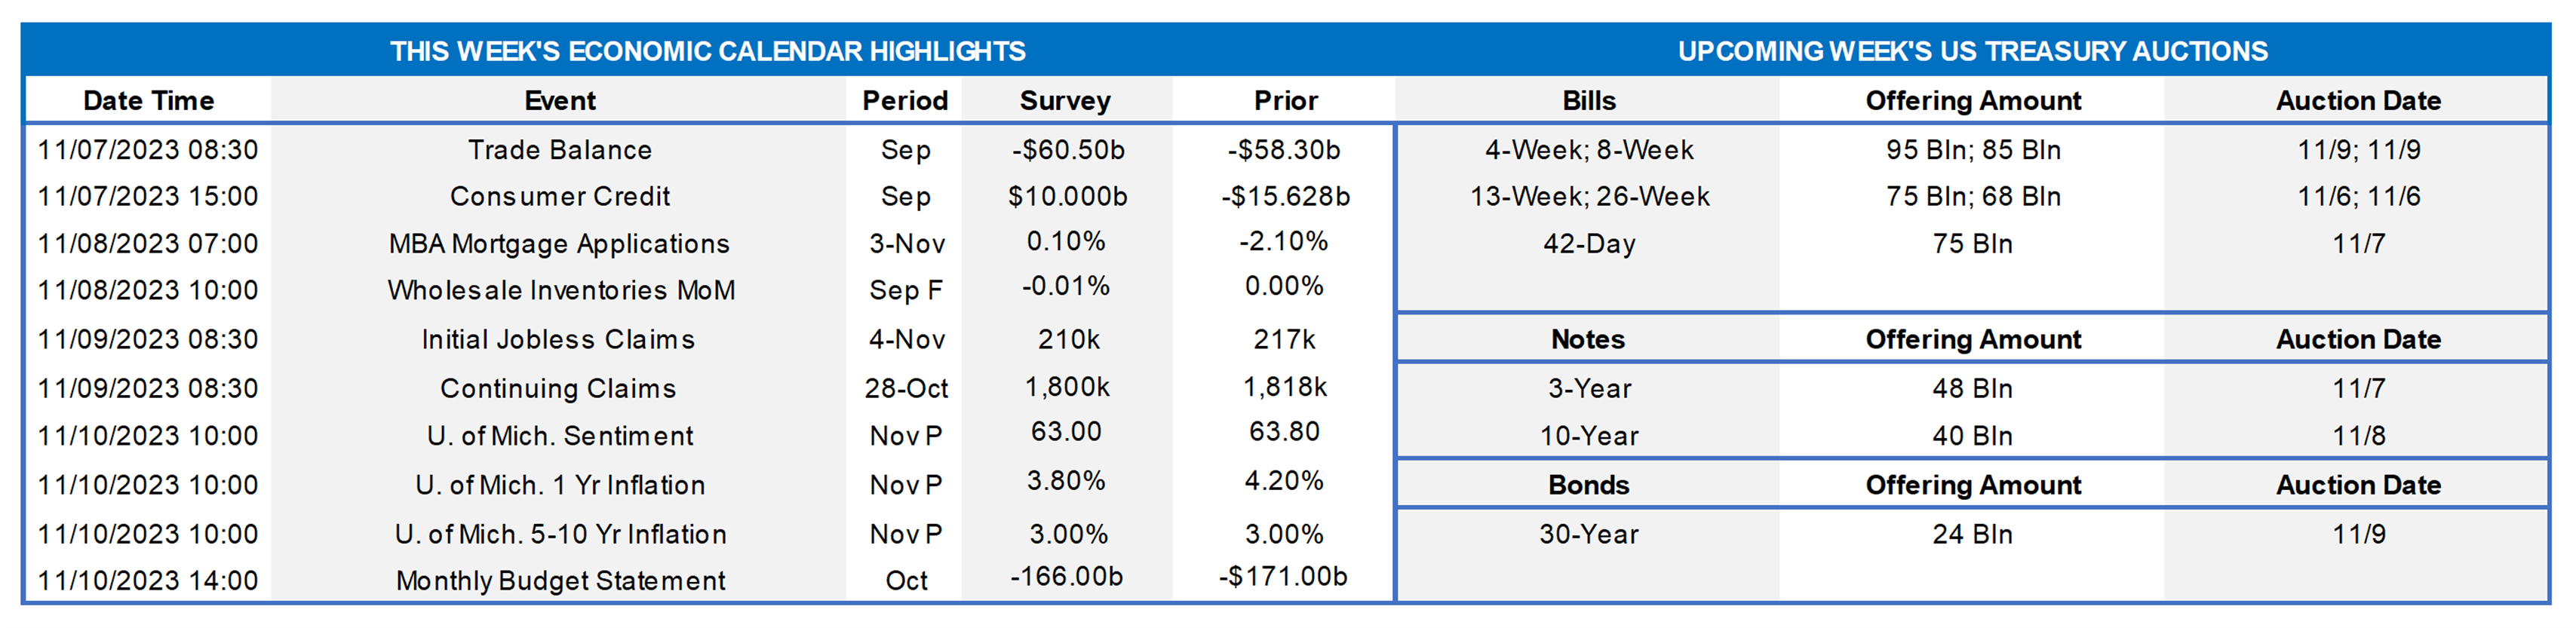
Following an eventful and volatile week, the upcoming week offers a marked downshift of the data calendar. With the Fed now out of blackout mode, the markets will surely follow Fed member comments on the economy and prospective rate path. The upcoming week contains a heavy slate of UST issuance, which may threaten the post-FOMC move lower in rates.
Trade Balance: The latest reading for September is expected to reflect a further increase in the deficit to -$60.5bn.
Consumer Credit: Forecasts for September are +$10bn, a positive swing higher from -$15bn the prior period.
Initial and Continuing Claims: Jobless claims are expected to remain close to prior readings from last week. The market will aim to decipher if any slowing trend is evolving on this front.
University of Michigan Sentiment: Prior reading was 63.8; this week’s release is expected to be about the same ~63.00.
University of Michigan 1-Year Inflation Estimate: The prior release for this inflation estimate was 4.20%, surely on the concerning side for the Fed’s liking. Economists forecast a reading a bit lower at 3.80% for this week.
University of Michigan 5-10 Year Inflation Estimate: The U of M long-term inflation estimate prior reading was 3.00% – this week’s release is expected to remain at the same level.
Upcoming Federal Reserve Speakers this week:
- 11/3 Minneapolis Fed President Kashkari speaks at the Economic Club of Minnesota.
- 11/3 Fed Governor Barr speaks about Community Reinvestment Act.
- 11/7 Dallas Fed President Logan speaks at Dallas/Kansas City Fed Energy Conference.
- 11/9 Chairman Powell speaks on Panel at IMF Conference.
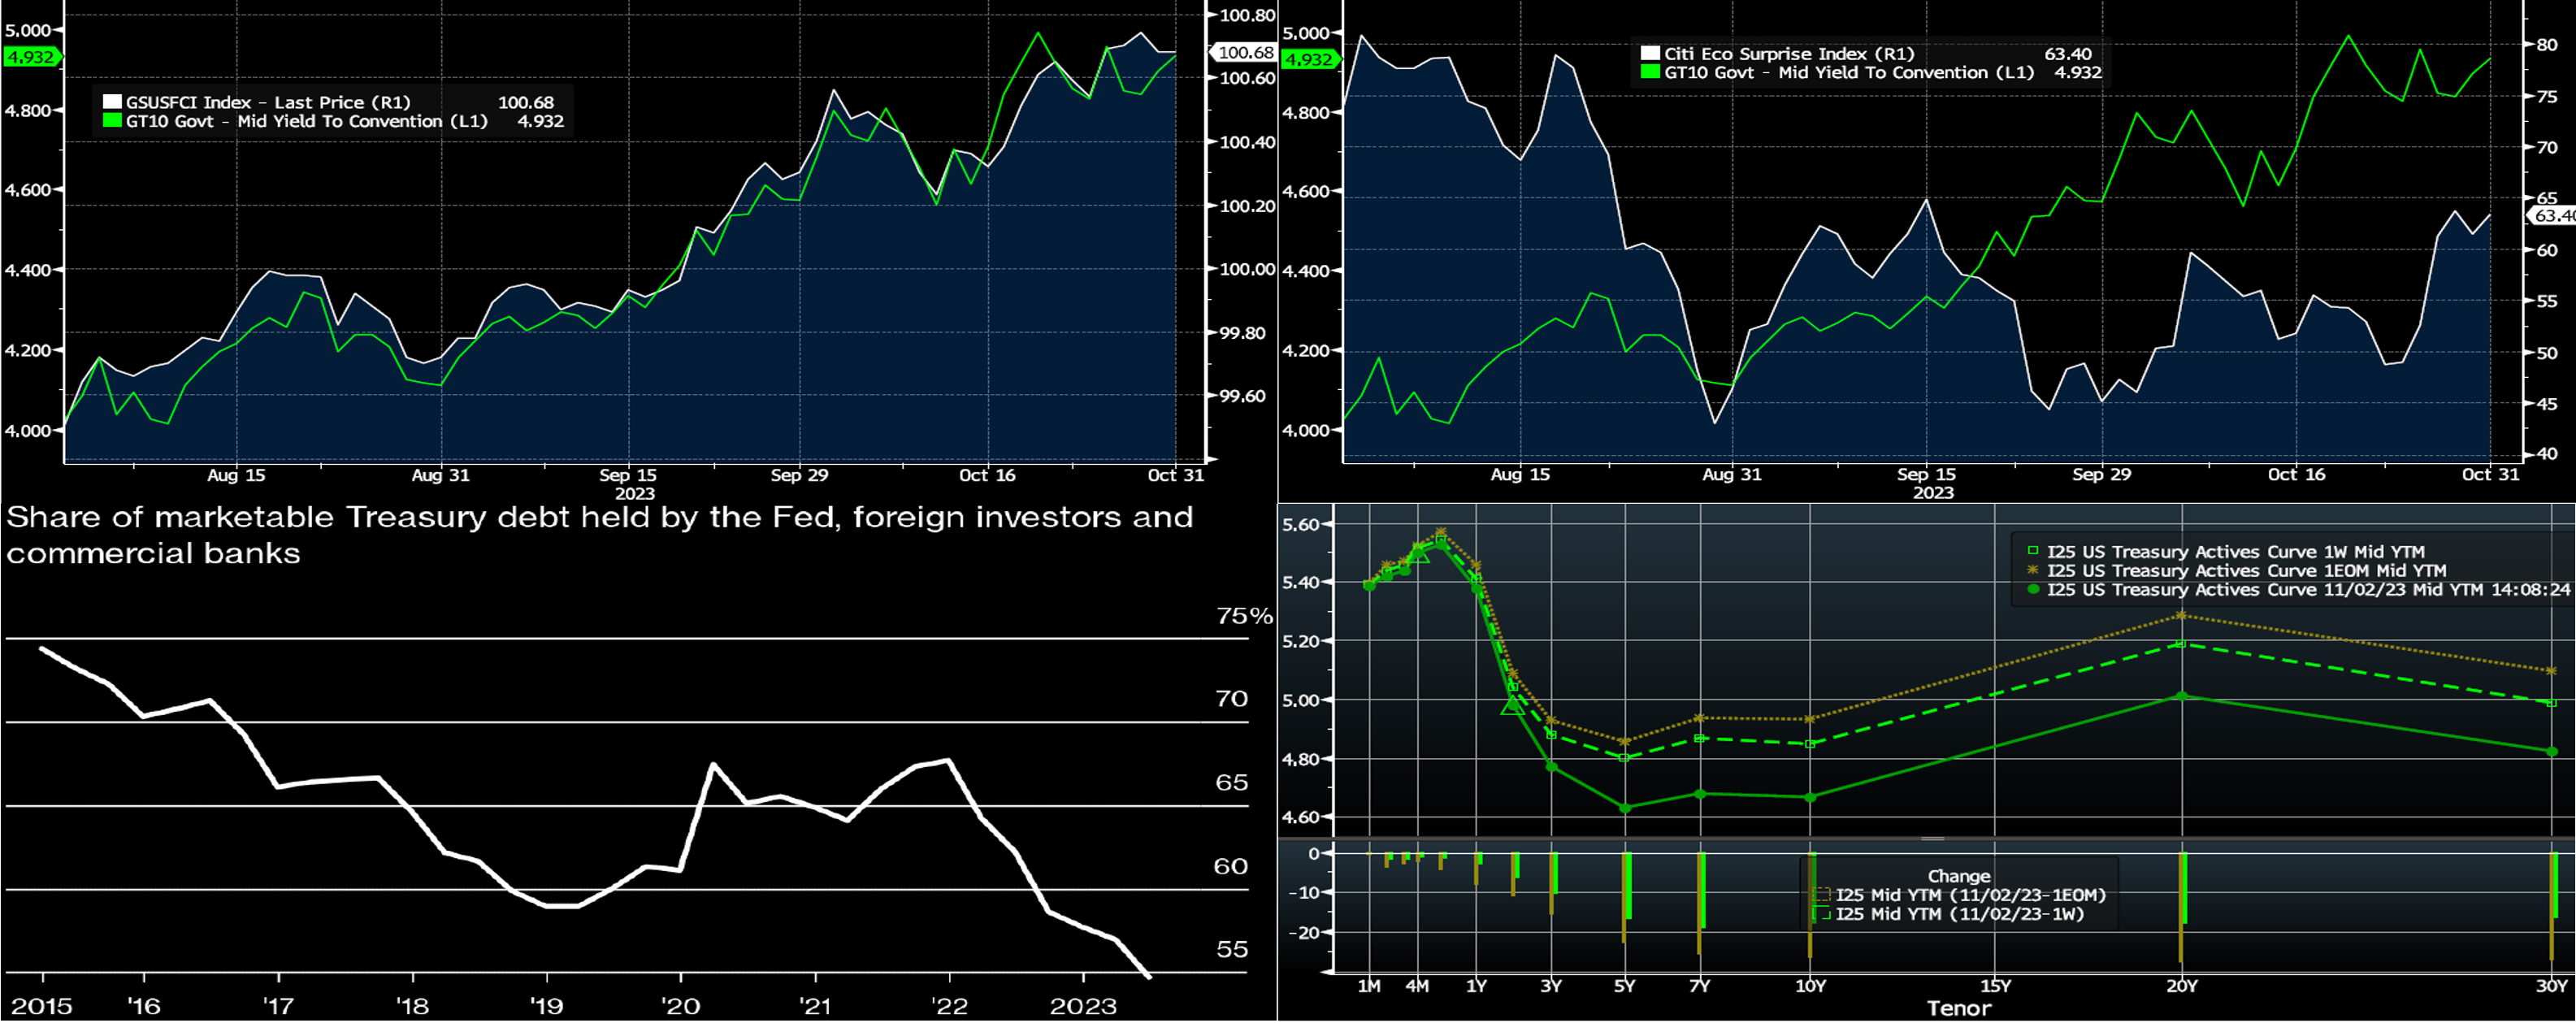
CHART 1 UPPER LEFT
Source: Bloomberg. Wednesday’s FOMC outcome was a “no change” on rates and so largely as expected. But both the statement and Chair Powell’s remarks contained direct references to “tighter financial and credit conditions,” presenting weights on economic activity going forward. These references may have been contributing factors to yields trading lower post-meeting. Shown here is the Goldman Sachs Financial Conditions Index (“FCI”, White, RHS) and the UST 10-year yield (Green, LHS, %) from August 1 to October 31. The FCI, basically, is defined as a weighted average of riskless interest rates, exchange rates, equity valuations, and credit spreads, with weights that correspond to the direct impact of each variable on GDP; an increase in the FCI indicates tightening of financial conditions, and a decrease indicates easing. As is evident, the FCI has been rising over this period, thereby signaling a tightening of conditions. And, judging by the rise in yields over this timeframe, rates have contributed heavily to the index move. Now it remains to be seen the lagged impacts on the economy from these conditions. In an ironic twist, however, the Fed’s mentions of this dynamic were followed by a bond and stock rally that has now slightly un-tightened conditions!
CHART 2 UPPER RIGHT
Source: Bloomberg. One of the reasons for the move higher in yields of the last few months has been stronger-than-expected economic data. Indeed, last week the Q3 GDP figure was 4.9% vs. expectations of 4.5%, the latter of which was hiked higher by market economists over the last month. Shown again here is the UST 10-year (Green, LHS, %) from August 1 to October 31, and charted too is the Citibank Economic Surprise Index (White, RHS), which measures data outcomes relative to expectations, with positive readings indicating upside surprises and negative readings downside surprises. The index has exhibited a few notable uptrends, and the basic takeaway is that a contributor to the rise in yields over the past few months has been these enduring upside surprises.
CHART 3 LOWER LEFT
Source: Bloomberg, JP Morgan. Here we resurrect a chart from a few months ago, which portrays the change in the ownership structure of the UST market and has likely been another contributor to higher yields and the oft-cited increase in the term premium demanded by investors to buy UST debt. As seen here, the share (RHS, %) of the market held by the Fed, foreign investors, and banks has been trending notably downwards. These sources tend to be more stable and reliable “buy and hold” types. But the Fed is now in portfolio runoff mode to the tune of ~$60bn/month. And banks have been reducing securities portfolios or at least not adding much, either for liquidity reasons or concerns of AOCI impacts. The result is that a larger share of the UST market is composed of types who are more “fast money” or multi-asset oriented and less likely to be long-term investors; in turn, this dynamic has surely contributed to higher price volatility.
CHART 4 LOWER RIGHT
Source: Bloomberg. Top pane is yield (LHS, %), bottom pane is change (LHS, bps). From last Thursday afternoon to this one, the UST curve notably bull flattened and thereby retraced some of the past few months’ moves outlined in the above color. As seen here, the move lower mostly occurred on Wednesday, as the UST Refunding announcement was lighter on longer-term bonds than expected, and then the FOMC contained a few dovish flourishes, both of which were catalysts for renewed UST buying and short-covering, which drove yields well below October month-end levels. In terms of market-implied pricing of the Fed, the peak Funds rate in February now stands at ~5.41%, a bp lower than last week and equating to ~33% chance of another 25 bps hike. The years 2024 and 2025 decreased a bit from a week ago as the market increased the chances/extent of rate cuts in that timeframe; the year-end 2024 forward was ~8 bps lower week-on-week, now ~4.52%.
FHLBNY Advance Rates Observations
Front-End Rates
- Short-end rates were mildly mixed week-over-week, with the shorter tenors mostly unchanged but 3-month-and-out a few bps lower, owing to the market re-pricing 2024 Fed rate projections a bit lower. Net T-bill supply remains positive, given announcements from Treasury regarding upsized auctions and issuance needs; the latest UST Refunding announcement this week noted a planned increase in T-bills’ share. But the supply continues to be absorbed relatively well as Money Market Funds (MMFs) switch from the Fed’s RRP to T-bills with competitive yields. Moreover, although shy of the recent high points, MMFs currently stand near all-time high AUM levels.
- Economic data, albeit relatively light, will likely be the main event this upcoming week.
Term Rates
- The longer-term curve, generally mirroring the moves in USTs and swaps, bull flattened week-on-week. While the 2-year was ~5 bps lower, the 5- and 10-year were ~14 and 16 bps lower, respectively.
- On the UST term supply front, the upcoming week serves a hefty slate of 3/10/30-year auctions. Note that UST auctions usually occur at 1 p.m. and can cause volatility around that time. Please contact the Member Services Desk for further information on market dynamics, rate levels, or products.
FHLB-NY is pleased to announce that we will offer $5 million in grant funding under the 2023 Small Business Recovery Grant (SBRG) Program on November 13, 2023. The SBRG Program provides grant funds to benefit FHLB-NY members’ small business and non-profit customers. Please watch for updates and visit the SBRG webpage.
Price Incentives for Advances Executed Before Noon – In effect as of Tuesday, September 5, 2023 – The FHLB-NY is pleased to now offer price incentives for advances executed before Noon each business day. These pricing incentives offer an opportunity to provide economic value to our Members, while improving cash and liquidity management for the FHLBNY. For further details, kindly refer to the bulletin.
The Symmetrical Prepayment Advance Feature
For those anticipating term funding needs, and with rates on an uptrend, it can be an appropriate juncture to consider our SPA feature. This feature allows the member to capture, at prepayment, changes in the fair value of the advance which are favorable to the member. Contact Member Services Desk to discuss.
Looking for more information on the above topics? We’d love to speak with you!
Questions?
If you wish to receive the MSD Weekly Market Update in .pdf format (includes FHLBNY rate charts) or to discuss this content further, please email the MSD Team.