Member Services Desk
Weekly Market Update
This MSD Weekly Market Update reflects information for the week of June 27, 2022.
Economist Views
Click to expand the below image.
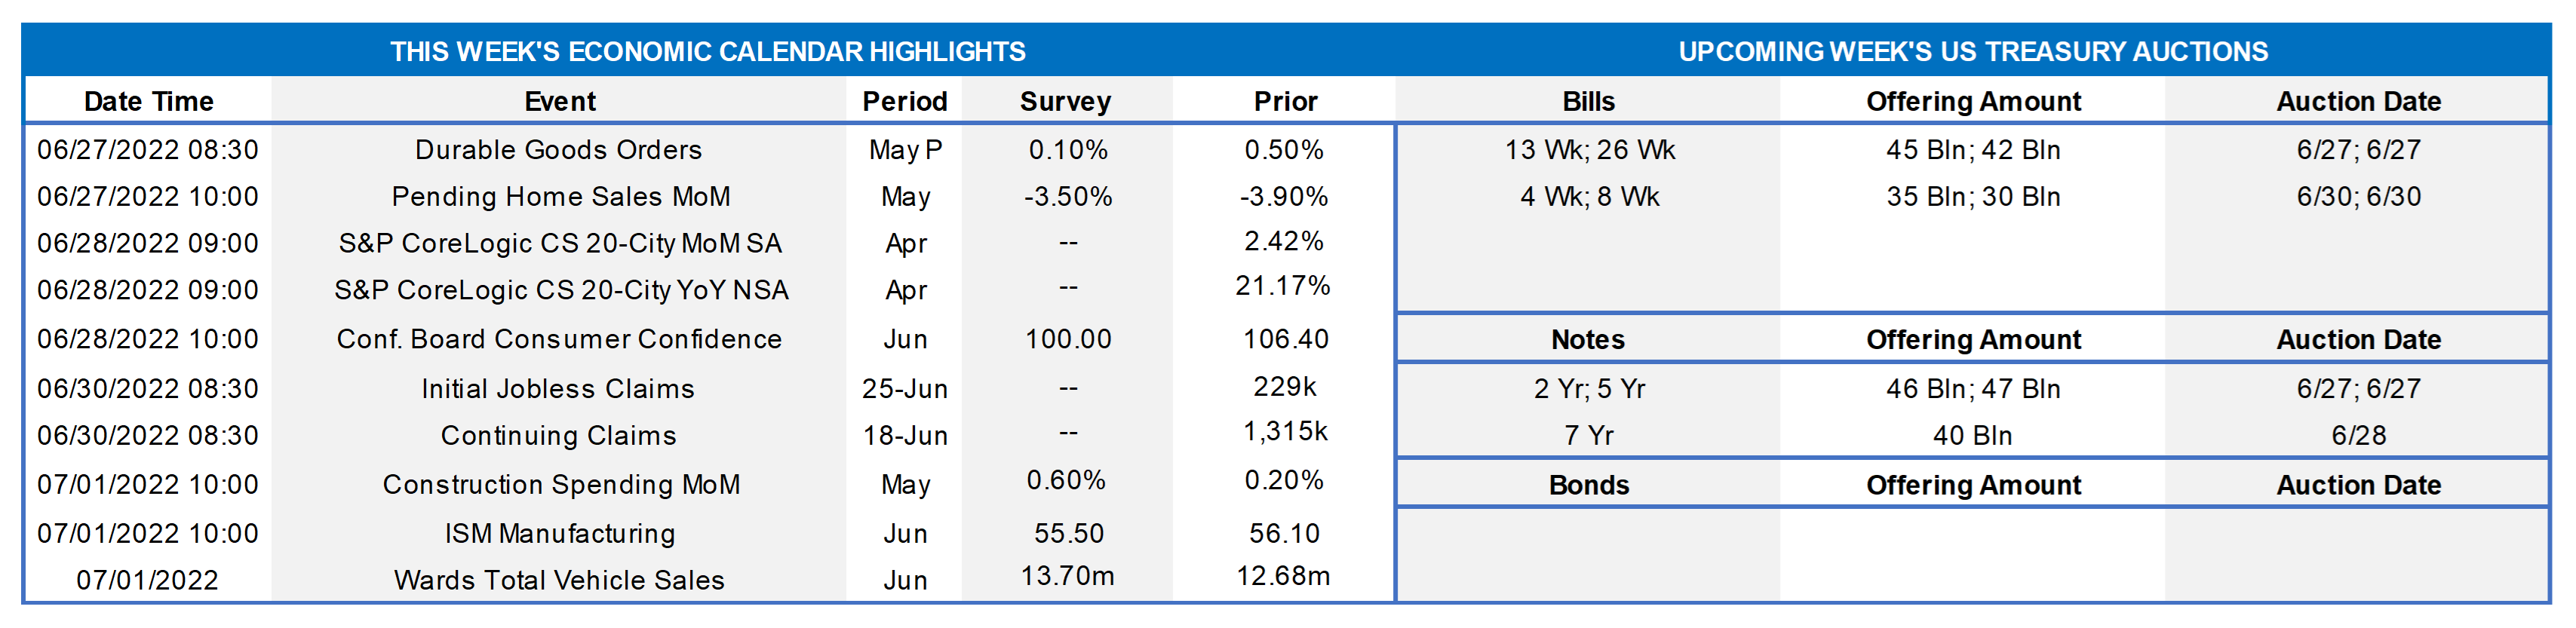
Market participants will contend with a crowded economic release calendar this week. May reports on consumer spending, construction outlays and nondefense capital goods shipments will allow economists to update their tracking estimates for current-quarter real GDP growth. As of this writing, the consensus anticipates a 3% annualized gain, after the 1.5% contraction posted during the winter. Home sale prices probably posted their largest year-to-year gain on record in April, while contract signings remained on a downtrend in May. Manufacturing activity probably rose in June, but at a slightly slower pace than in May. Following Federal Reserve Chair Jerome Powell’s appearances before Congress the past week, the Fed-speak schedule will be very light.
Durable Goods Orders: Durable goods bookings are expected to have edged .4% higher in May, almost matching April’s .5% rise. May’s nondefense capital goods shipments excluding commercial jetliner deliveries will be watched closely to gauge the strength of business equipment spending in the spring quarter.
Pending Home Sales: Surging mortgage rates, combined with limited supplies of dwellings on the market, probably left contract signings lower for a seventh consecutive month in May.
S&P CoreLogic Case-Shiller (SPCLCS) 20-City Home Price Index: Home prices probably climbed across each of the metropolitan areas canvassed by SPCLCS, for a record 22nd consecutive month in April. An anticipated 2.3% increase during the reference period would place prices received by sellers a whopping 21.7% above those recorded in April 2021.
Conference Board Consumer Confidence: Surging inflation and dramatically higher interest rates likely weighed on consumers’ appraisals of current and prospective economic conditions, leaving the Conference Board’s sentiment gauge at a 16-month low of 100 in June.
Construction Spending: The nominal value of new construction likely climbed by .7% in May, after a modest .2% uptick in April, boosting the cumulative increase over the latest 12 months to 12.3%.
ISM Manufacturing Index: The nationwide manufacturing expansion probably entered its third year in June, although the pace of activity likely slowed marginally from May’s reported clip. The Street expects the ISM Manufacturing Purchasing Managers Index to retreat to 55.8% from 56.1% in the preceding month.
Motor Vehicle Sales: Motor vehicle purchases are expected to have rebounded in June, following the five-month low seasonally adjusted rate of 12.7mn recorded in May. The median forecast of 13.7mn would leave sales of passenger cars and light trucks just slightly above the average posted over the March-May span.
Federal Reserve Appearances:
- June 28 San Francisco Fed President Mary Daly to be interviewed by LinkedIn Chief Economist.
- June 29 Cleveland Fed President Loretta Mester to take part in a panel discussion at the ECB’s annual policy forum.
Special Note to readers: The Member Services Desk Weekly Market Update will return on Monday, July 11th. Enjoy the holiday!
Click to expand the below image.
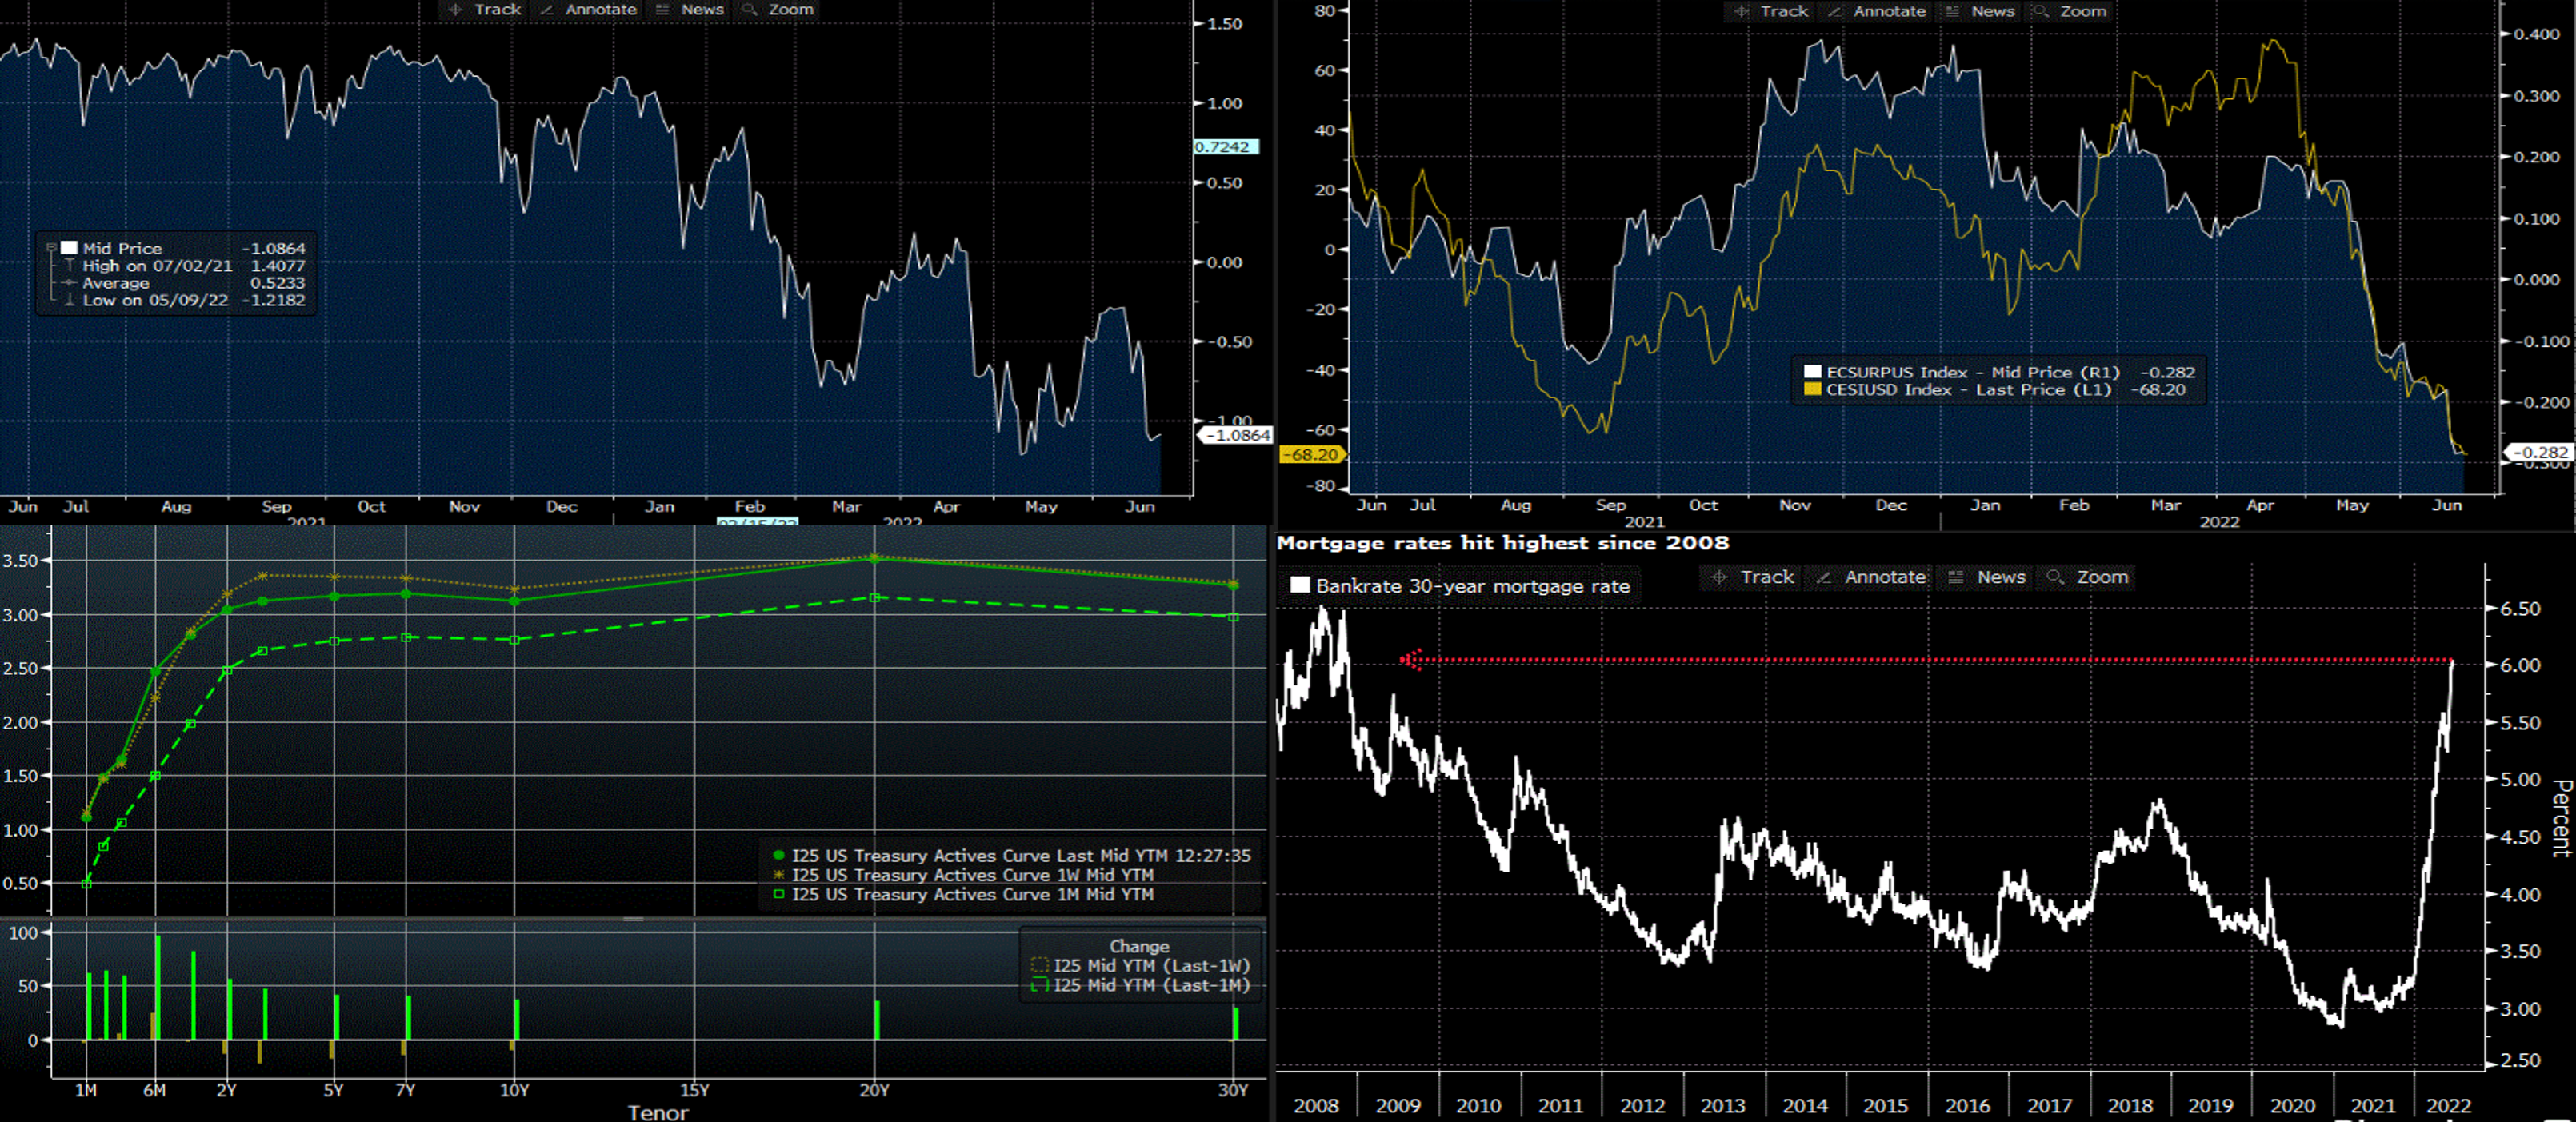
CHART 1 UPPER LEFT
Source: Bloomberg. Owing to the Fed’s policy tightening and selloff in financial markets of the past few months, financial conditions have notably tightened, as exhibited here in Bloomberg’s US Financial Conditions Index. This index tracks the overall level of financial stress in the U.S. money, bond, and equity markets to help assess the availability and cost of credit. A positive value indicates accommodative financial conditions, while a negative value indicates tighter financial conditions relative to pre-Great Financial crisis (late 2000s) norms. It includes measures of volatility, stock and bond valuations, and credit spreads. Unlike episodes of financial conditions tightening over the past decade, the Fed is currently engineering much of this tightening and, indeed, welcoming it in an orderly fashion in and to cool inflationary forces.
CHART 2 UPPER RIGHT
Source: Bloomberg. Portrayed here is both Citibank’s (LHS, gold) and Bloomberg’s (RHS, white) Economic Surprise Indices. These indices essentially track and measure the actual results of economic data releases relative to the consensus market expectations for the data. As seen here, data has clearly underwhelmed vs. expectations in the past month. Economists, in turn, have revised their growth outlooks a bit downward and raised probability estimates of a recession next year or shortly thereafter.
CHART 3 LOWER LEFT
Source: Bloomberg. Note: Top pane is yield (%), bottom pane is change (bps). As of Friday afternoon, yields were lower across the curve from the week prior from the 2-year point and longer by 10-23bps. The week-on-week change understates the actual “ups and downs” and volatility witnessed during the week, following the rate hike last week by the FOMC. Inflation fears are being felt throughout the market.
CHART 4 LOWER RIGHT
Source: Bloomberg. A component of the tighter financial conditions cited above is notably higher mortgage rates; indeed, as seen here, the 30-year mortgage rate has reached levels not experienced since 2008. This trend has already led to a plunge in “refis” and prepayments, and it is expected to crimp further growth in home sales activity and prices.
FHLBNY Advance Rates Observations
Front-End Rates
- Short-end Advance rates finished a bps lower week-over-week. Short-end markets remain volatile, thereby leading to dynamic intraday and day-to-day moves in rates. While there are large amounts of cash chasing limited supply in the front-end, the pricing of Fed hikes continues to pressure yields higher. As of this past Friday midday, the market priced for a high chance of another 75 bps hike for the July 27th FOMC. And then a ~40% chance of another 75 bps hike is priced for the Sept. 21st FOMC. This pricing, and the fact that maturities are crossing further into the timeline of the Fed hiking cycle, contributed to the rate moves.
- Given the Fed tightening posture and upcoming FOMC meetings, rates will remain highly responsive to the market’s moves and pricing of the Fed.
Term Rates
- Longer-term rates finished lower, week-over-week, generally mirroring the move in the UST market. While 1-year was 7 bps lower, the 2-year was 9 bps lower, and the 5-year 16 bps lower. Kindly refer to the previous section for further color on relevant market dynamics.
- On the UST term supply front, this upcoming week contains 2/5/7-year auctions. The focus will be on Fed-speak and a busy data slate. The market is likely to remain volatile. Please call the desk for information on market dynamics, rate levels, or products.
Product Alert: FHLBNY is pleased to announce enhancements to our Advance Rebate Program, which provides members an opportunity to receive a cash rebate when prepaying an eligible advance and rebooking a new advance within a 30-day period. Rebate-eligible advances now must have a minimum of 6-months (reduced from 1-year) remaining. Moreover, the potential cash rebate has been increased. This program can be suitable for those wishing to extend their liability duration and/or potentially improve net interest margin. Please call the Member Service Desk at (212) 441-6600 for more information.
Forward Start Advance (FSA): For members with upcoming borrowing or refunding plans, consider the FSA as a method to opportunistically “lock in” rates before advance settlement date. Please call the Member Service Desk at (212) 441-6600 for more information.
The Symmetrical Prepayment Advance Feature
With rates at or near multi-year lows, it is a compelling juncture to use the SPA feature on term advances. This feature allows member to capture, at prepayment, changes in the Fair Value of the advance which are favorable to the member. Contact us to discuss.
Looking for more information on the above topics? We’d love to speak with you!
Questions?
If you wish to receive the MSD Weekly Market Update in .pdf format (includes FHLBNY rate charts) or to discuss this content further, please email the MSD Team.