Member Services Desk
Weekly Market Update
This MSD Weekly Market Update reflects information for the week ending October 20, 2023.
Economist Views
Click to expand the below image.
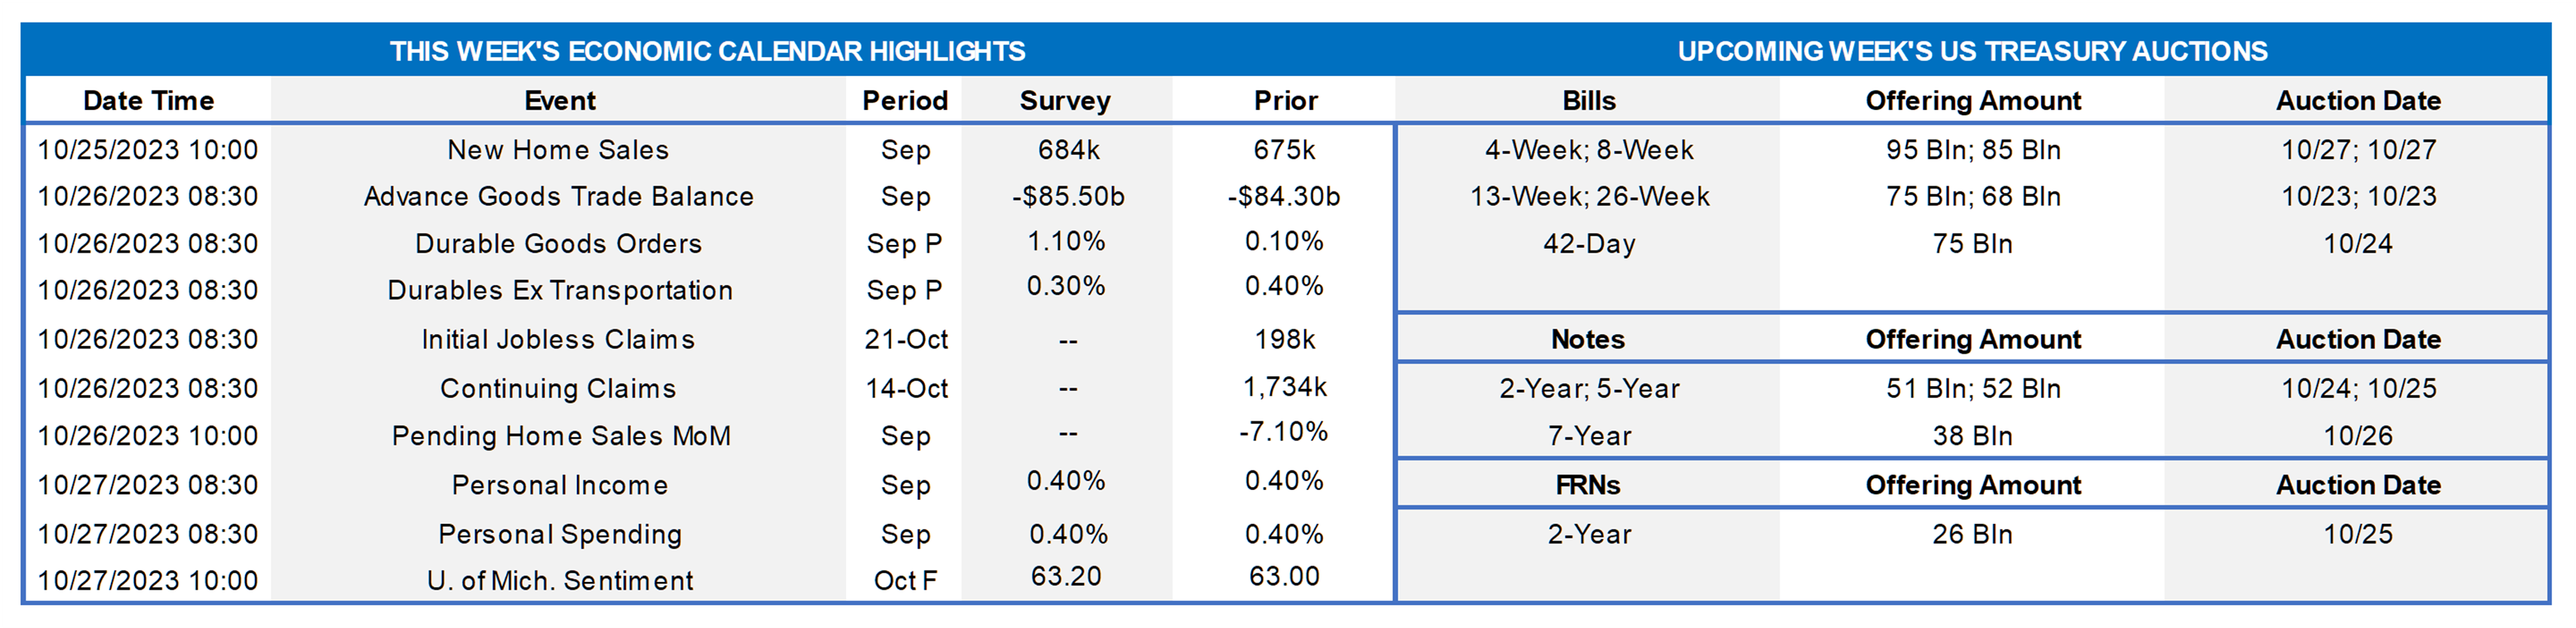
With policymakers observing the traditional blackout period on public appearances ahead of the October 31-November 1 Federal Open Market Committee meeting, market focus will center on the economic release calendar. The marquee report will undoubtedly be the Bureau of Economic Analysis’ (BEA) initial pass at real GDP growth during the summer quarter. An almost uninterrupted string of upbeat soundings has prompted economists to mark their projections for Q3 real GDP growth higher. Indeed, the median Q3 real GDP forecast now calls for a 3% annualized gain, up from 2% annualized a month ago. While a limited amount of key input data remains to be released ahead of the BEA’s advance report on October 26, the range of forecasts remains wide, extending from a paltry .5% uptick to a hefty 6% gain. Of note, the Atlanta Fed’s GDPNow model, which accurately called the BEA’s initial estimates for both Q1 and Q2, currently projects a 5.4% annualized increase in inflation-adjusted activity in Q3 – triple the estimated long-run pace of the U.S. economy. Looking beyond Q3, the consensus anticipates a sharp slowdown in real GDP growth to a below-trend, or less than 1.8% annualized, clip over the final three months of this year that will extend through next summer.
New Home Sales: Reported increases in single-family building permits and housing starts suggest that contracts to purchase newly constructed dwellings climbed by 3.6% to a seasonally adjusted annual rate of 700K in September, reversing a portion of the 8.7% drop witnessed in August.
Merchandise Trade Balance: Anticipated movements in goods exports and imports are expected to have left the merchandise trade deficit slightly wider at $85.5bn in September, following an $84.6bn shortfall in the prior month.
Durable Goods Orders: Powered by a projected rebound in commercial jetliner bookings, durable goods orders probably climbed by 1% in September, after a modest .1% uptick in the preceding month. Net of the expected strength in transportation equipment requisitions, hard goods booking likely edged .3% higher during the reference period, almost matching the .4% prior-month gain. As always, pay particular attention to core nondefense capital goods shipments, excluding jetliner deliveries, for clues to the strength of business equipment spending as Q3 ended.
Pending Home Sales: Despite the continuing dearth of available dwellings on the market, contracts to purchase a home probably rebounded in September after August’s surprising 7.1% fall.
Jobless Claims: Hinting at yet another solid jobs report, initial claims for unemployment benefits probably remained in a historically low 200-210K range during the filing period ended October 21.
Personal Income & Spending: Personal income growth probably quickened in September, climbing by .5% after a .4% gain in August. By contrast, consumer spending growth likely slowed during the reference period, rising by .3% following a .4% prior-month increase, implying a slight uptick in the personal saving rate from the 3.9% set in August.
Michigan Sentiment Index: Buoyed by a series of upbeat economic reports, consumer confidence probably improved over the latter half of October, prompting an upward adjustment to the 63.2 reading posted in the University of Michigan’s early-month canvass.
Federal Reserve Appearances: None, as Federal Reserve officials will observe the traditional blackout period ahead of the Oct. 31-Nov. 1 FOMC meeting.
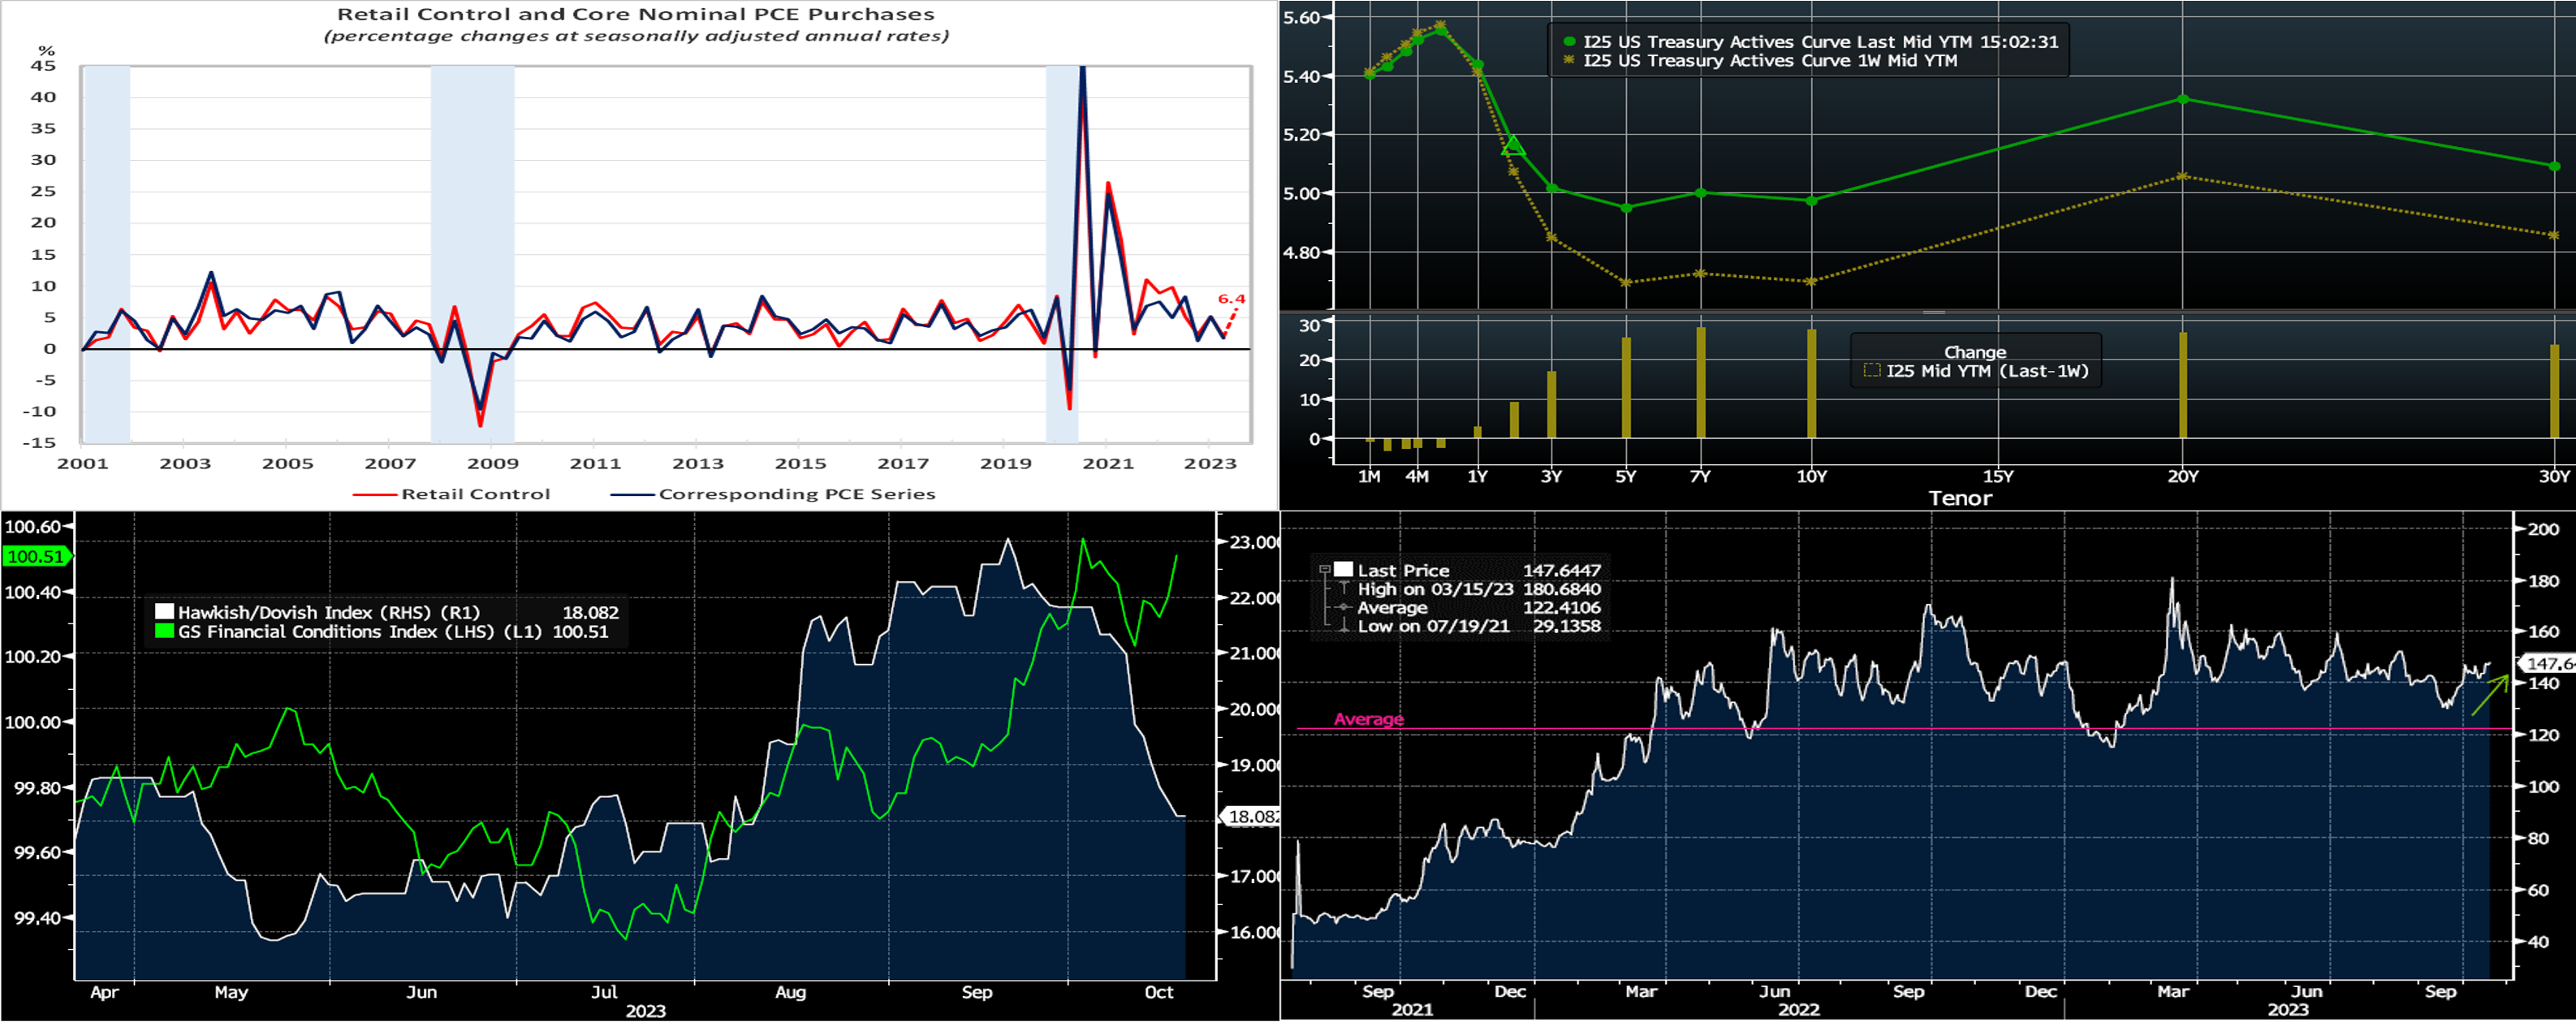
CHART 1 UPPER LEFT
Source: Commerce Department; National Bureau of Economic Research; FHLB-NY. Note: Shaded areas denote recessions. Retail and food services sales beat all economists’ projections in September. The Census Bureau reported purchases climbed by 0.7%, following upwardly revised gains of 0.8% in August and 0.6% in July. Revenues were stronger across eight of the 13 major business segments canvassed during the reference period. Excluding outlays on autos, building materials and gasoline, retail “control” – the portion of the Census Bureau’s report that is used by the Bureau of Economic Analysis to estimate nominal consumer goods spending – rose by a stronger-than-expected 0.6%. That rise, along with prior-month upward adjustments, placed core sales during the summer quarter 6.4% annualized above their April-June average, up from the 2% annualized pace set in Q2. This development points to a sizable contribution from the consumer to the expected acceleration in Q3 real GDP growth.
CHART 2 UPPER RIGHT
Source: Bloomberg. Top pane is yield (LHS, %), bottom pane is change (LHS, bps). From last Thursday afternoon to this one, the UST curve notably bear steepened towards or through pre-financial crisis highs of the mid to late 2000’s. While the 2-year was up by ~9 bps, the 5 to 10-year zone was over 25 bps higher. The market completely erased any of the Israeli conflict-related moves from early the prior week, and stronger-than-expected economic data, especially Tuesday’s retail sales release, reinforced a “higher-for-longer” rates theme. In terms of market-implied pricing of the Fed, the 2023 peak Funds rate moved from December to February and now stands at ~5.44%, equating to a ~44% chance of another 25 bps hike. The years 2024 and 2025 increased from a week ago, as the market reduced the chances/extent of rate cuts in that timeframe; the year-end 2024 forward was ~15 bps higher week-on-week, now ~4.76%.
CHART 3 LOWER LEFT
Source: Bloomberg. Shown here is Goldman Sachs’ Financial Conditions Index (Green, LHS) and JP Morgan’s Fed Speeches Hawk-Dove Score Index (White, RHS). The recent runup in rates and bear steepening of the curve has been cited by market watchers as a trend that is “doing the Fed’s work for it,” and, in that respect, may obviate the need for further Fed hikes. Indeed, even Fed officials have acknowledged this cause-and-effect possibility. The rise in longer maturity yields to multi-decade highs has served to tighten financial conditions, per the GS index (higher is tighter). Meanwhile, the hawkish tone of Fedspeak has moderated over the past month, per the decline in the JPM index. Surely, the next FOMC will take the curve’s move into consideration at the looming November 1st FOMC.
CHART 4 LOWER RIGHT
Source: Bloomberg. Portrayed here is the implied volatility (“implied vol”), in annual bps form (White, RHS), of a 1-year into 2-year swaption. As seen here, it has risen markedly since early September and is well above its average of the past few years. All else equal, higher implied vol increases the price of an option and vice-versa. What does the 147.6 bps shown here mean? Basically, it represents a one standard deviation measure in the calculation of the option price; the market prices a ~68% chance that the 2-year swap rate 1-year from now will be within +/- 147.6 bps from the current forward rate. This swaption structure is a key component in a 3-year No-put 1-year (“3NP1”) Advance. All else equal, implied vol moving higher will reduce the coupon on a putable advance since entering a putable incorporates the sale of an option. In this example here, and again “all else equal,” a 10 bps increase in vol would reduce a 3NP1 European-style coupon by ~4 bps. Of course, “all else equal” never occurs in dynamic markets, but it is worthwhile to be aware of and possess a basic understanding of the vol component in this and all option-embedded products. As always, please call the Member Services Desk with any questions or for further information.
FHLBNY Advance Rates Observations
Front-End Rates
- Short-end rates were a few bps lower week-over-week, with the shortest tenors leading the change; the 4-month–and-in was 1 to 4 bps lower, but 5 and 6-month were unchanged. Improved funding levels and the market slightly reducing the chance of another hike this year both helped the moves. Net T-bill supply remains positive, given announcements from the Treasury regarding upsized auctions and issuance needs. But the supply continues to be absorbed relatively well as Money Market Funds (MMFs) switch from the Fed’s RRP to T-bills with competitive yields. Moreover, although off the recent high points, MMFs currently stand at or near all-time high AUM levels.
- The upcoming week’s economic data will likely be the focus, given that Fedspeak will be in blackout mode.
Term Rates
- The longer-term curve, generally mirroring the moves in USTs and swaps, notably bear steepened week-over-week, with 2-year ~11 and 5-year ~24 bps higher. Please call the Member Services Desk for further information on markets and/or products and pricing.
- On the UST term supply front, and in a challenging bond market, the upcoming week serves a large slug of 2/5/7-year auctions. Note that UST auctions usually occur at 1 p.m. and can cause volatility around that time. Please contact the Member Services Desk for further information on market dynamics, rate levels, or products.
Price Incentives for Advances Executed Before Noon – In effect as of Tuesday, September 5, 2023 – The FHLB-NY is pleased to now offer price incentives for advances executed before Noon each business day. These pricing incentives offer an opportunity to provide economic value to our Members, while improving cash and liquidity management for the FHLBNY. For further details, kindly refer to the bulletin.
The Symmetrical Prepayment Advance Feature
For those anticipating term funding needs, and with rates on an uptrend, it can be an appropriate juncture to consider our SPA feature. This feature allows the member to capture, at prepayment, changes in the fair value of the advance which are favorable to the member. Contact Member Services Desk to discuss.
Looking for more information on the above topics? We’d love to speak with you!
Questions?
If you wish to receive the MSD Weekly Market Update in .pdf format (includes FHLBNY rate charts) or to discuss this content further, please email the MSD Team.