Member Services Desk
Weekly Market Update
This MSD Weekly Market Update reflects information for the week of February 14, 2022.
Economist Views
Click to expand the below image.
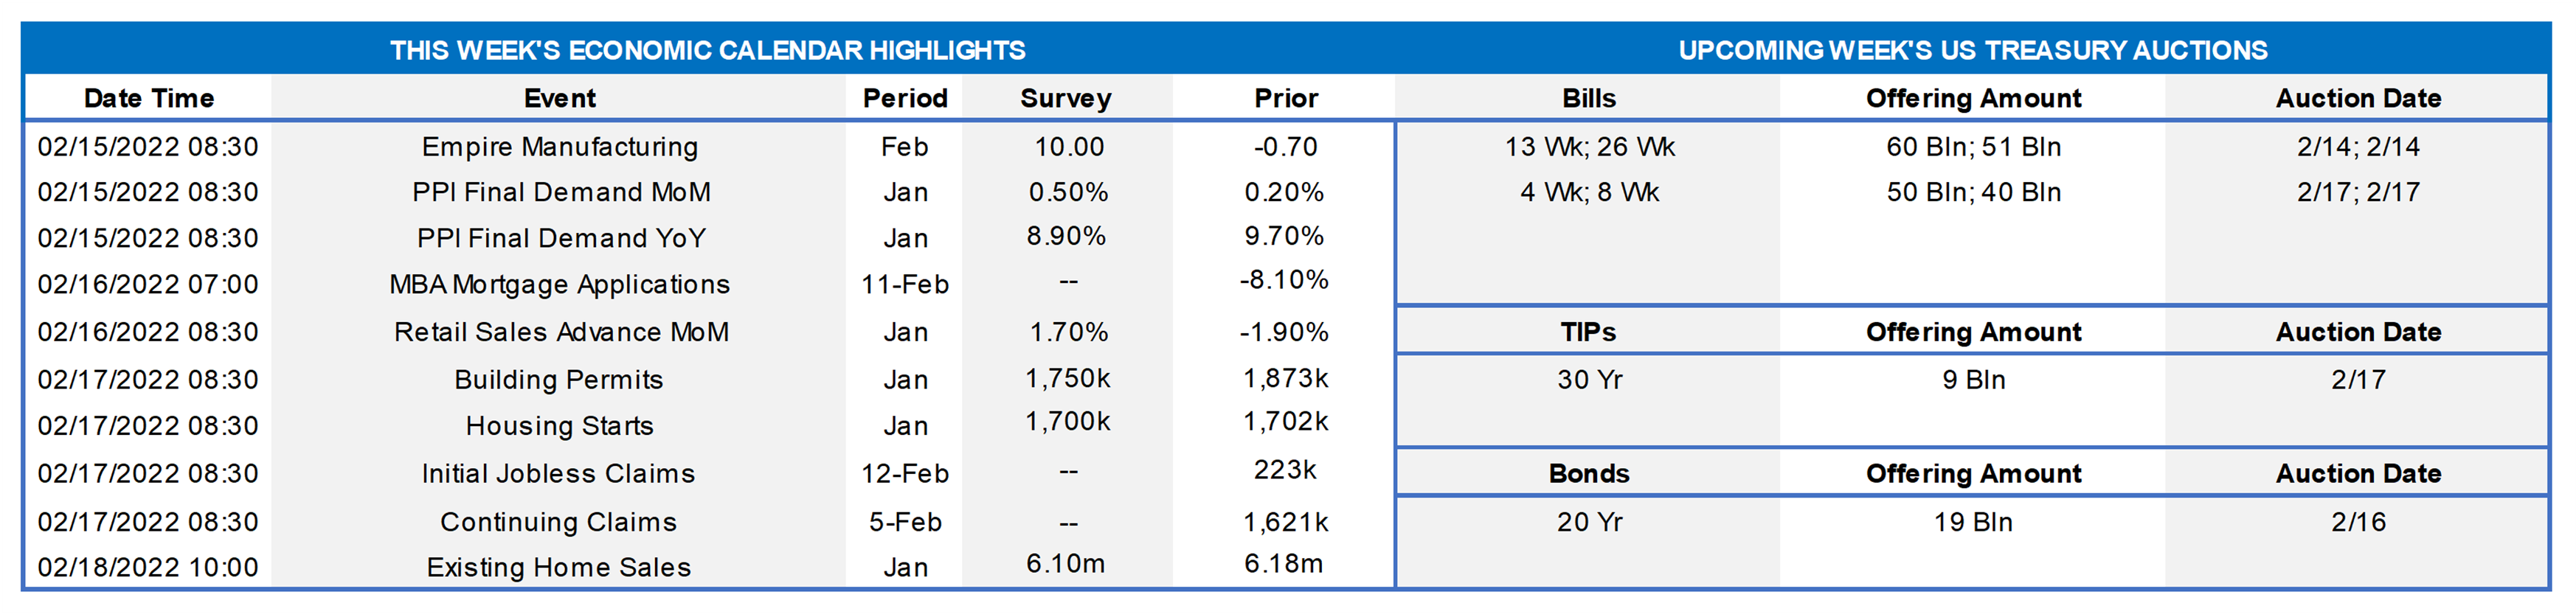
Having weathered yet another steamy report on consumer price inflation and hawkish comments by Federal Reserve officials, market attention will return to key inputs into current-quarter business activity. Retail sales probably rebounded at the beginning of 2022, but considerable ground will still need to be made up to reverse the effects of estimated December declines. Powered by a pickup in manufacturing, industrial production likely climbed in January, after a modest prior-month dip. Home-builders’ assessments of sales and prospective buyer traffic are expected to have remained high in February. Other housing data probably will be mixed. Favorable weather conditions may have boosted groundbreakings last month, but fewer contract signings in November and December point to a decline in existing home sales. A quartet of current Federal Open Market Committee voting members are slated this week to give their views on the economy and monetary policy.
Empire State Manufacturing Survey: Manufacturing activity in New York State likely expanded in February, following a modest dip in the preceding month. The net percentage of survey respondents experiencing a pickup in general business conditions is expected to have rebounded to 12% from -.7% in January.
Retail and Food Services Sales: Expected to have rebounded by 1.8% in January, the data should reverse most of December’s 1.9% decline. Net of an anticipated rebound in auto-dealership revenues during the reference period, retail sales likely climbed by 1%, after a 2.3% yearend drop. Data-watchers will be focus on the so-called control sales excluding auto, building materials and gasoline purchases. Barring any prior-month revisions, the expected 1% gain would leave core purchases a very soft 5.4% annualized below their October-December average, after a 5.7% Q3 gain.
Industrial Production & Capacity Utilization: Production at factories, mines, and utilities probably rebounded at the beginning of 2022, climbing by .4% after a modest .1% dip in December. With output likely eclipsing additions to productive capacity during the reference period, the overall operating rate likely rose by .3 percentage point to 76.8% – the highest level since November 2019.
NAHB Housing Market Index: To be released on the 16th, home-builders’ appraisals of conditions likely remained upbeat, with the index holding steady at 83, well above the neutral 50-point mark.
Housing Starts & Building Permits: Anticipated to remain at a seasonally adjusted annual rate of 1.7mn in January, unusually dry weather conditions across the country suggest that an upside surprise could be in the offing. Bloated in December by the prospective enactment of several real estate tax provisions in Philadelphia, PA, the number of new building permits issued – a closely followed leading indicator of prospective residential construction activity – probably declined by 7.2% to 1.75mn, following an upwardly revised 9.8% prior-month leap.
Jobless Claims: Initial and continuing state unemployment insurance claims likely moved lower in their respective reporting periods, as the Nation emerges from the Omicron variant outbreak.
Existing Home Sales: The pullback in purchase-contracts over the November-December span would be consistent with a 2.9% dip in existing home sales to a 5-month low SAAR of 6mn in January. With normal seasonal patterns pointing to a 30K contraction in the number of homes on the market to a record low of 880K, the stock of unsold homes likely registered at just 1.8 months’ supply.
Index of Leading Economic Indicators: To be released on the 18th, available data suggest that prospective activity edged just .2% higher in January, after a .8% increase in the previous month.
Federal Reserve Appearances:
- Feb. 14 St. Louis Fed President James Bullard to speak on CNBC.
- Feb. 16 Minutes of January 25-26 Federal Open Market Committee to be released.
- Feb. 17 St. Louis Fed President James Bullard to discuss the economic and policy outlook.
- Feb. 17 Cleveland Fed President Loretta Mester to give virtual speech on economic and monetary policy outlook.
Click to expand the below image.
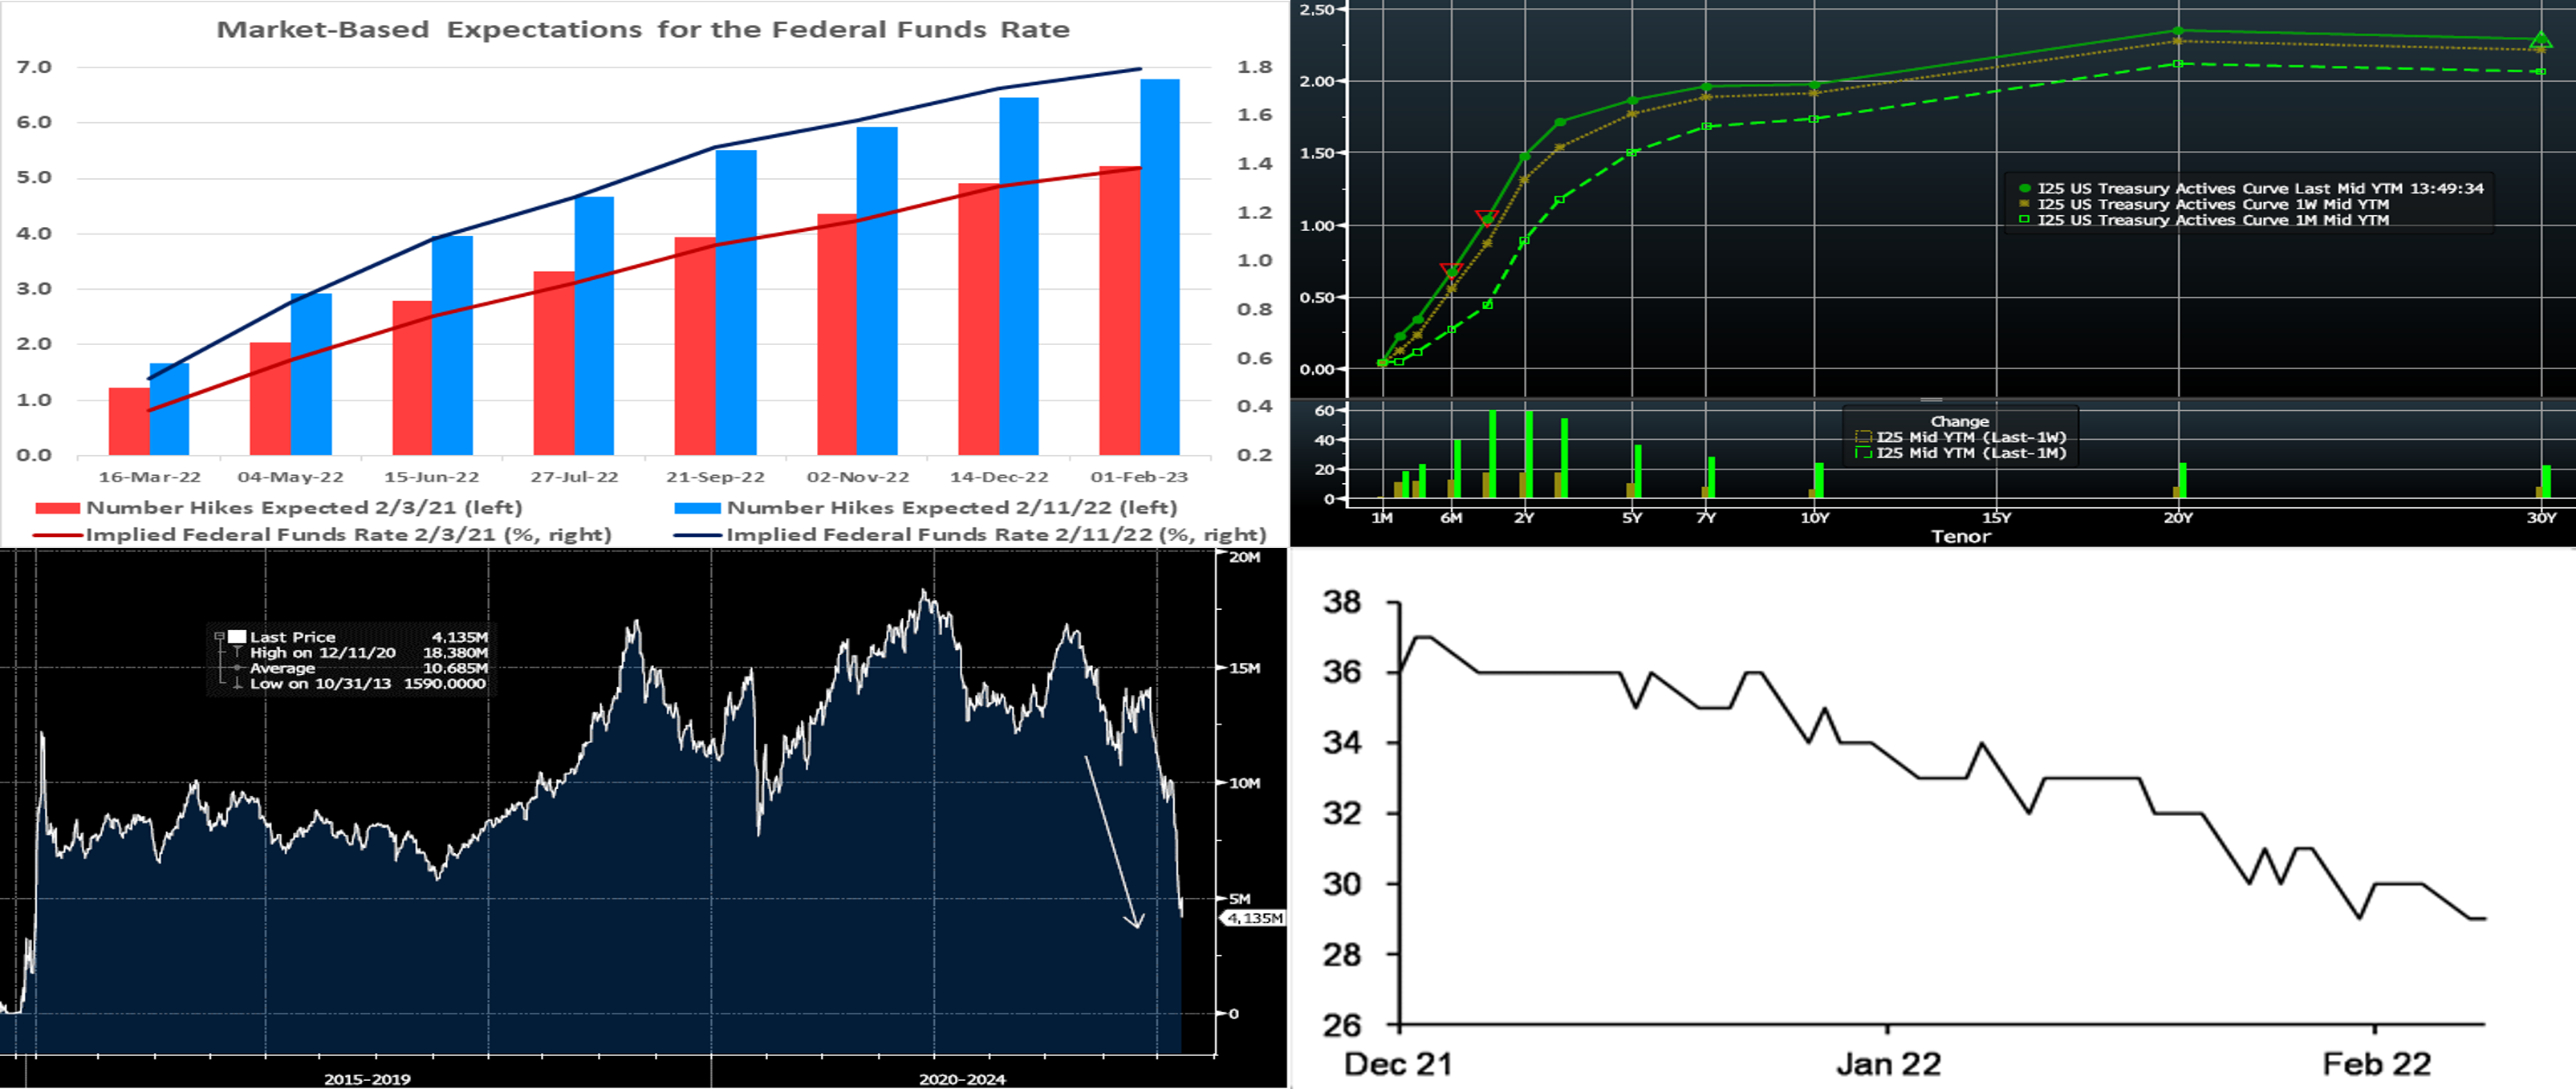
CHART 1 UPPER LEFT
Source: Bloomberg; FHLBNY. Reports on labor market conditions and consumer prices in January, along with public comments by Fed officials, have prompted dramatic changes in market expectations of prospective interest-rate increases. Indeed, the market now prices for ~85% probability that the initial hike in the federal funds rate target range will be a 50 bps move to a new .5% to .75% range. For 2022, the yield curve currently prices the equivalent of ~6.5 hikes of 25 bps, up from a little less than five prior to the release of last month’s jobs report. Multiple market strategists this week revised higher their forecasts of Fed hikes, in response to the inflation data and Fed-speak. The most notable Fed-speak, though subsequently cooled somewhat by others, was Fed Governor Bullard’s expressions on Thursday of potential support for a 50 bps and/or inter-meeting “emergency” hikes.
CHART 2 UPPER RIGHT
Source: Bloomberg. Note: Top pane is yield (%), bottom pane is change (bps). As of midday Friday, the UST yield curve rose again, with the bulk of the move occurring on Thursday post the higher-than-expected CPI report. Yields were ~7 to 18 bps higher from the week prior, in a “bear flattener” move led by shorter maturities. Yields remain notably higher than a month ago, in reaction to economic data and Fed-related dynamics, per the above color. Volatility, both day-to-day and intraday, in markets remains high. Members should monitor conditions for potentially more optimal transaction timing. In a reflection of the timing and volatility themes, yields were even higher on Friday until midday when, during this writing, they plunged 6 to 9 bps in a “risk-off” mode as stocks sank. Market focus this upcoming week will be on Tuesday’s PPI report and Fed-speak, given the current importance of the inflation topic and the Fed’s response to it. A final note on Fed-hike pricing in the curve is that the market still prices the Fed Funds rate for “out-years” at well below (at ~1.90%) that of the Fed Dot Plot’s longer-run estimate (at 2.5%). This dynamic will be interesting to monitor, as further data and Fed action unfold.
CHART 3 LOWER LEFT
Source: Bloomberg. The rise in yields over the past few months has not solely been a US-based phenomenon. Forces of resurgent economic growth along with inflation risks, and potential or actual central bank tightening in response, have spurred a large and widespread repricing higher of global sovereign yields. As seen here, the value (in USD terms) of global negative yielding debt has plunged nearly $10trn since December 2021 to currently reside ~$4.1trn, a level last seen back in 2015. Paltry yields elsewhere have served to boost demand for USTs among global investors, but now global yield curves are re-pricing to a new paradigm.
CHART 4 LOWER RIGHT
Source: iMoneyNet; JP Morgan. Government Money Market Funds (MMF) have sharply reduced their duration profile over the past two months, with their Weighted Average Maturity (WAM) now down to 29 days (LHS, WAM in days). This trend appears to be due to increased buying of short-dated fixed paper, floating paper, and/or RRP usage. This shift has surely been in response to the expected onset of Fed hikes, and it has contributed to the steepening of money-market curves and, in turn, our advance rates.
FHLBNY Advance Rates Observations
Front-End Rates
- Short-end Advances are again higher, sharply so, from the prior week, as the market prices for Fed tightening (per color on the previous slide) and maturities cross into the timeframe of hikes. High cash levels persist in the short-end, as demand for the Fed’s RRP, which stands last at ~$1.63trn, remains strong. Money market fund AUM remains high, although falling again by ~$34bn in the past week. However, with ~85% chance of a 50 bps hike priced into the curve for the mid-March FOMC meeting and then over a 100% chance of a 25 bps hike for the May FOMC, investors demand higher yield for anything but the shortest paper. Advance rates were ~20 bps higher week-over-week out to 4-month and then a bit higher thereafter; 6-month finished 25 bps higher.
- To reiterate, as time ensues and maturities cross into or further past upcoming FOMC meetings, these maturities’ rates are likely to experience further upward drift.
Term Rates
- The advance rates curve generally mimicked the UST curve week-over-week and finished notably higher and flatter, with most of the move occurring on Thursday. Levels rose by ~6 to 19 bps, with the 1 to 4-year zone leading the increases.. Kindly refer to the previous section for further color on relevant market dynamics.
-
On the UST supply front, this week brings UST auctions of a 20-year bond and a 30-year TIPS. Rates are highly prone to moves on inflation data and Fed-speak. Given market volatility, members should monitor conditions for potentially more optimal timing on transactions. Please call the desk for information on market dynamics, rate levels, or products.
FHLBNY is pleased to announce enhancements to our Advance Rebate Program, which provides members an opportunity to receive a cash rebate when prepaying an eligible advance and rebooking a new advance within a 30-day period. Rebate-eligible advances now must have a minimum of 6-months (reduced from 1-year) remaining. Moreover, the potential cash rebate has been increased. This program can be suitable for those wishing to extend their liability duration and/or potentially improve net interest margin. Please call the Member Service Desk at (212) 441-6600 for more information.
The Symmetrical Prepayment Advance Feature
For those anticipating term funding needs, and with rates on an uptrend, it can be an appropriate juncture to consider our Symmetrical-feature advance. This feature allows the member to capture, at prepayment, changes in the fair value of the advance which are favorable to the member. Please contact our Member Service Desk to discuss.
Looking for more information on the above topics? We’d love to speak with you!
Questions?
If you wish to receive the MSD Weekly Market Update in .pdf format (includes FHLBNY rate charts) or to discuss this content further, please email the MSD Team.