Member Services Desk
Weekly Market Update
Economist Views
Click to expand the below image.
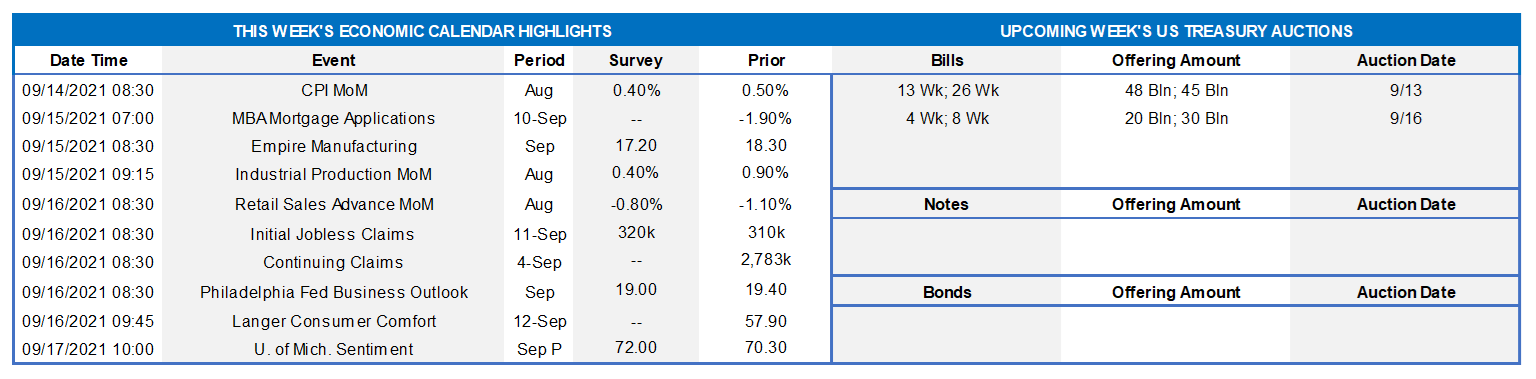
With the Federal Reserve officials observing the traditional blackout period ahead of the September 21-22 FOMC meeting, the focus of market participants will be on the economic release calendar this week. The latest edition of the Fed’s Beige Book indicated that economic growth had downshifted to a moderate pace over the July-August span. The deceleration in business activity was attributed to pullbacks in dining out, travel, and tourism, due to rising safety concerns prompted by the Delta variant outbreak. Supply disruptions and widespread labor shortages, as opposed to weaker demand, are also capping growth in other areas of the economy. While current-quarter real GDP projections are in a state of flux, it is doubtful that the 6.4% annualized pace set over the first half of the year will be matched. August figures on consumer prices, industrial output, and retail sales will provide important information on the magnitude of the summer-quarter slowdown.
NFIB Small Business Optimism Index: Already reported increases in potential hiring, open positions, and net compensation suggest that the National Federation of Independent Business’ sentiment barometer likely rebounded last month, after a 2.8-point decline to 99.7 in July.
Consumer Price Index: Capped by an anticipated decelerations in retail food and energy costs, CPI is expected to have climbed .4% higher in August, following a .5% prior-month rise. Net of projected movements in volatile food and energy prices, the core CPI probably edged .3% higher for a second straight month. Those forecasts, if realized, would place the overall and core CPIs 5.3% and 4.3% above their respective year-ago levels.
Empire State Manufacturing Survey: Manufacturers in NYS are expected to report that general business activity expanded for a 15th consecutive month in September, albeit at a slightly slower pace than in August. The general business conditions diffusion index – the percentage of respondents experiencing a pickup in activity less those witnessing a decline – probably retreated to 17.2% from 18.3% in the previous month.
Industrial Production & Capacity Utilization: Powered by a projected rise in factory output, industrial production likely rose by .4% in August, after a .9% increase in July. With output likely eclipsing additions to productive capacity during the reference period, the overall operating rate probably climbed by .2 percentage point to 76.3% – the highest reading since the pandemic forced the closing of the economy in March 2020.
Retail & Foods Services Sales: The Census Bureau’s update on retail activity in August will provide important information on consumer spending growth. A supply-related dive in auto purchases, along with a likely falloff in restaurant visits attributable to the Delta variant outbreak, probably left retail and food services sales .8% lower last month, after a 1.1% decline in July. As always, market participants will be paying particular attention to so-called control sales excluding auto, building materials, and gasoline purchases in this week’s report. Barring any prior-month revisions, the .2% dip anticipated by the Street would leave core purchases over the July-August span 2.4% annualized below their prior-quarter average, following an impressive 15.3% annualized Q2 gain.
Jobless Claims: Initial and continuing claims under regular state unemployment insurance programs probably declined during their latest respective reporting periods. However, those figures continue to overstate the improvement in the labor market from the worst of the pandemic. Indeed, as of the week ended August 21, 12.1mn persons were still receiving some sort of unemployment assistance, down from the pandemic peak of 32.4mn reached a year ago but still well above the 2.1mn prevailing before the shuttering of the economy. Using August’s level as a base, 7.5% of the civilian labor force were receiving some form of unemployment insurance payments three weeks ago.
Michigan Sentiment Index: Weekly data suggest that the U of M’s barometer probably rose from 70.3 in August to 75.5 in early September, reversing almost half of last month’s 10.9-point dive.
Federal Reserve: None – blackout period ahead of Sept. 21-22 meeting.
Click to expand the below images.
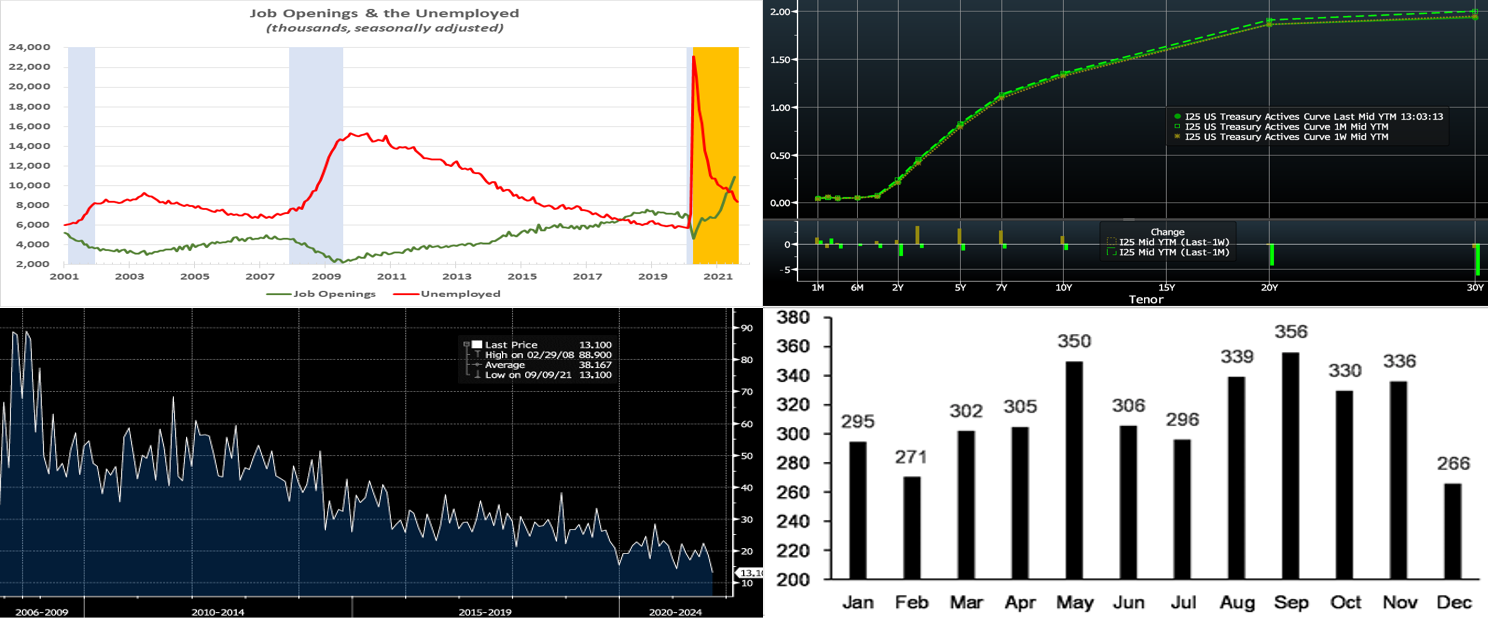
CHART 1 UPPER LEFT
Source: Bureau Labor Statistics; National Bureau of Economic Research; FHLB-NY. Note: Blue-shaded areas denote recessions; Orange-shaded area denotes current economic expansion. Demand for new workers rose sharply at the beginning of the summer quarter. Indeed, the BLS reported that available job openings swelled by 749K to a record 10.9mn in July. All areas of the country witnessed an increase in help wanted, with firms in the Northeast hoping to fill an estimated 73K positions. With 8.7mn members of the civilian labor force classified as unemployed during the reference period, the excess of job openings less the jobless widened to an all-time high of 2.2mn. Given likely mismatches between skills required and those possessed by the unemployed, labor-market conditions probably are even tighter than that gap suggests.
CHART 2 UPPER RIGHT
Source: Bloomberg. Note: Top pane is yield (%), bottom pane is change (bps). Seen clearly here, yields have been fairly rangebound and modestly changed over the past month, as the curve remains in a sort of stalemate between the potentially looming onset of the Fed’s taper later this year and the negative impacts of the ongoing pandemic. In recognition of the latter, many economic forecasters have adjusted downwards their GDP calls; newly announced federal measures to increase vaccination rates may stem further pandemic impacts, however, and so bear monitoring. As expected, September has begun with a surge of fixed income supply, but demand remains robust; more color can be found below on these dynamics. Week-over-week as of midday Friday, UST yields closed a few bps higher from 3 to 10-year but were mostly unchanged otherwise.
CHART 3 LOWER LEFT
Source: Bloomberg. Shown here is the historical primary dealer “takedown” (how much they bought, in % of the bond issue size) of UST 30-year auctions. At 13.1%, this past Thursday’s takedown was a historic low. The result prompted the move lower in yields on Thursday afternoon, although this move was largely reversed the next day. The dealer takedowns at recent auctions in various maturities has likewise been low in historical context. A takeaway from this observation is that demand for UST’s, and for fixed income product in general for that matter, remains strong among investors and is likely to quell a severe reaction to a Fed taper announcement.
CHART 4 LOWER RIGHT
Source: JP Morgan. Seasonally, September tends to be the heaviest month of the year for fixed income duration supply; indeed, the month has already witnessed a surge of corporate bond issuance and more is expected throughout the month. Depicted here is the gross duration supply in UST’s, MBS, High Grade Credit and Municipals by month, 2016-2020 average (in $bn of 10-year UST equivalents). Clearly, September is usually a big month, as investors and issuers return from summer slowdowns. While the expected surge in issuance might be expected to exert some upward pressure on rates, thus far this has not been the case, and, as reflected above, investor demand remains robust.
FHLBNY Advance Rates Observations
Front-End Rates
Short-end advance rates finished unchanged on the week. Money Market Funds’ AUM decreased by ~$4.7bn this past week, but demand for short paper and the Fed’s RRP, which stands ~$1.1trn, remains strong. The overall supply/demand paradigm persists in suppressing rate levels, as the GSEs continue to invest large sums into money markets, the TGA continues its decline, and short-maturity paper is in short supply. =
UST issuance overall is now net positive supply in that more is being issued than what the Fed is buying in its programs. However, with short UST rates at rock-bottom levels and the Fed on hold, rates are likely to persist in a near-term sideways pattern. Importantly, weekly net T-bill issuance has been lower since 2020 and negative in recent months, and Treasury intends to shift issuance out the curve. Moreover, the looming federal debt ceiling may further constrain issuance. Further legislative packages and related borrowing may lead to an eventual increase of T-bill auction sizes and positive net supply, but for now overall market supply/demand dynamics should keep short rates in check from large moves to the upside.
Term Rates
The Advance rate curve was modestly changed from a week prior. The 3 to 5-year sector was ~3 bps higher, while other terms were a bp or two higher. Kindly refer to the previous section for further color on relevant market dynamics.
On the UST supply front, this week brings reprieve in auctions. The market will monitor economic data and developments on the pandemic front. Heavy corporate issuance will continue to add supply to the market but likely be easily absorbed.
Product Enhancement Alert: FHLBNY this past week announced an enhancement to the Callable Adjustable Rate Credit Advance (“Callable ARC”). The product features a 1-time call/cancel option (member’s option) to extinguish funding early at no cost via two distinct option structures, thereby giving members flexibility in meeting the demands of a fluctuating balance sheet. Given the shorter-term nature of the current borrowing environment, the minimum term for the Callable ARC has been lowered to 4-month (from the previous 7-month) for our 1-month-left-to-maturity call option (SOFR or 1-month Libor index available) to better meet our members’ needs. Meanwhile, the 3-year Non-Call 2-year product for SOFR continues to be offered to members for their longer-term needs.
New Product Alert: In order to satisfy member needs and provide greater product flexibility to match bond and derivative market conventions, FHLB-NY now offers SOFR-linked advances based on SOFR-index compounding. Note that this product is in addition to SOFR-linked advances based on SOFR-index averaging which have been offered since November 2018.
The Symmetrical Prepayment Advance Feature
With rates at or near multi-year lows, it is a compelling juncture to use the SPA feature on term advances. This feature allows member to capture, at prepayment, changes in the Fair Value of the advance which are favorable to the member. Contact us to discuss.
Looking for more information on the above topics? We’d love to speak with you!
Questions?
If you wish to receive the MSD Weekly Market Update in .pdf format (includes FHLBNY rate charts) or to discuss this content further, please email the MSD Team.
Special Member Alert
The FHLBNY recently announced a newly expanded and flexible Disaster Relief Funding (DRF) advance program which offers discounted rate advances with maturities 1-mo and greater. Additionally, we have announced that PPP loans will be accepted as eligible collateral. Please contact us with any questions.