Member Services Desk
Weekly Market Update
This MSD Weekly Market Update reflects information for the week of June 6, 2022.
Economist Views
Click to expand the below image.
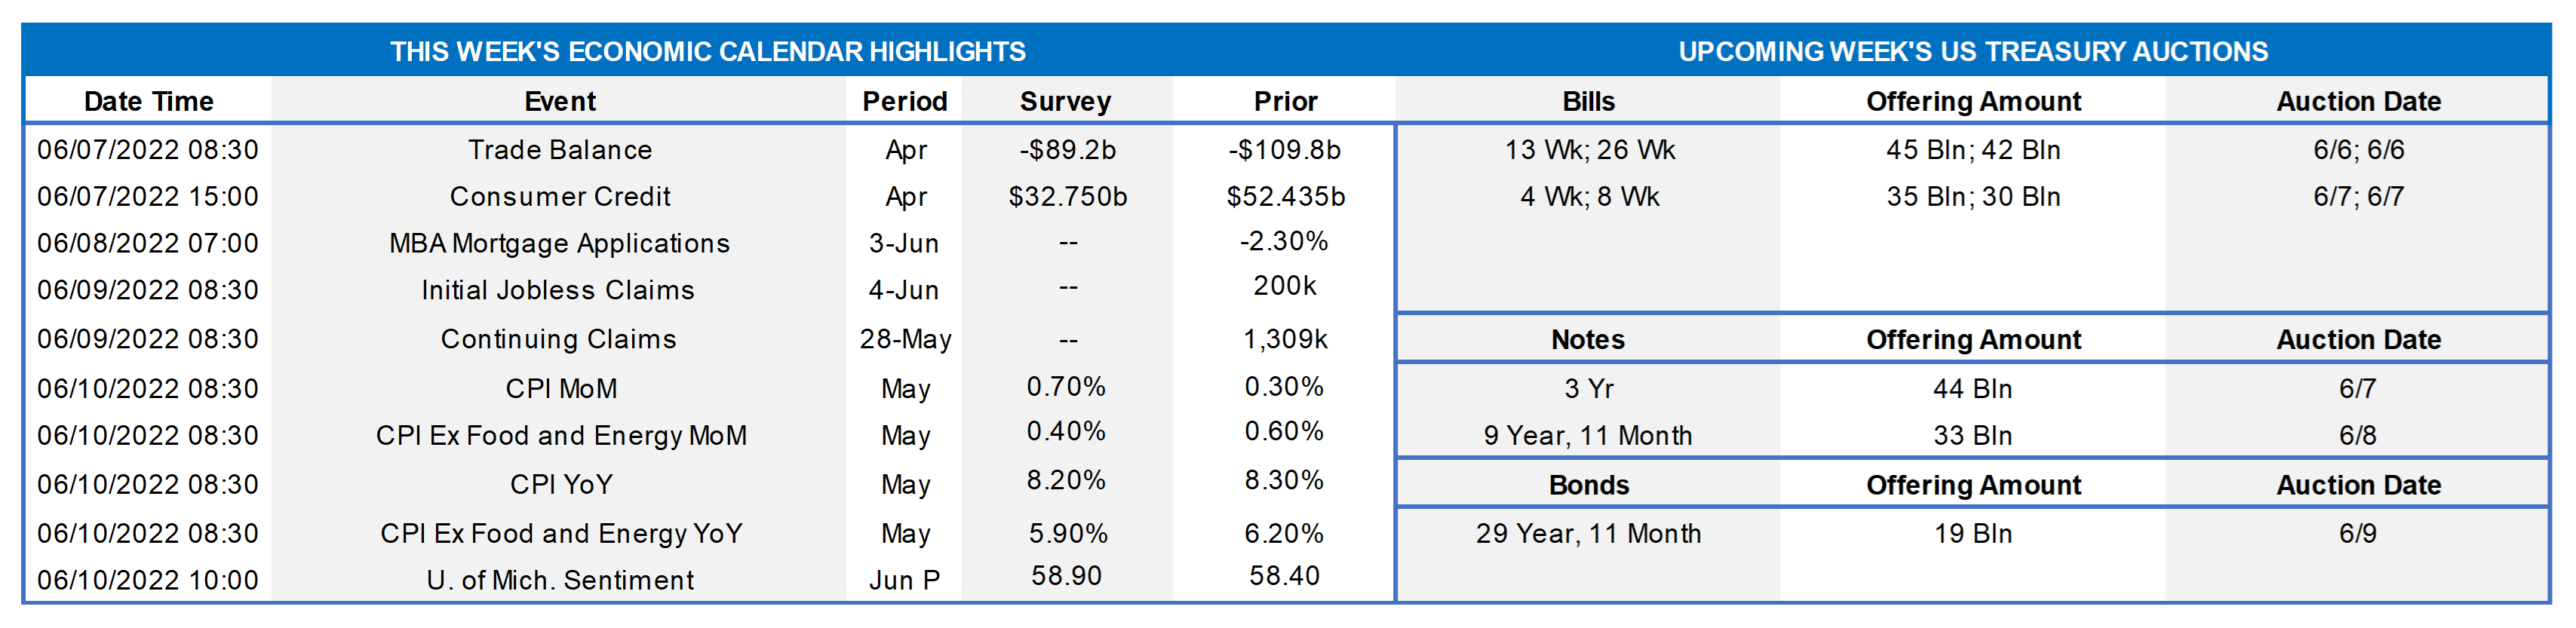
Market participants confront a very light economic release calendar this upcoming week. The marquee report will be the Bureau of Labor Statistics’ update on consumer goods and services costs last month. Year-to-year increases in closely followed inflation measures are expected to remain well above the level desired by policymakers. The international trade deficit is expected to have closed markedly in April, suggesting that the external sector’s drag on real GDP growth in Q2 will be significantly smaller than during the winter quarter. Weekly labor market soundings likely will improve. Federal Reserve officials will observe the traditional blackout period ahead of the June 14-15 FOMC meeting.
International Trade Balance: Prompted by a sharp reduction in the merchandise trade gap, the shortfall in international trade in goods and services is expected to narrow to $89.5bn in April from the record $109.8bn deficit recorded in March.
Consumer Credit: Consumer installment credit is expected to have risen by $34bn in April, following the record $52.4bn takedown posted in the prior month.
Jobless Claims: Consistent with the ongoing tightness in labor-market conditions, initial and continuing jobless claims probably moved lower in their respective reporting periods.
Consumer Prices: A snapback in retail energy costs likely propelled the Consumer Price Index (CPI) .7% higher in May, after a .3% increase in April. Excluding anticipated increases in ever-volatile food and energy costs, the so-called core CPI probably rose by .5%, following a larger-than-expected .6% hike in the previous month. Those projections, if realized, would leave the overall and core CPIs 8.3% and 5.9% above their respective year-ago levels, well above the 2% mark desired by Federal Reserve officials.
University of Michigan Sentiment Index: Consumer confidence probably steadied in early June, after dropping to a fresh decade low of 58.4 in May, due to respondents’ growing concerns on inflation.
Federal Reserve Appearances: None
Click to expand the below image.
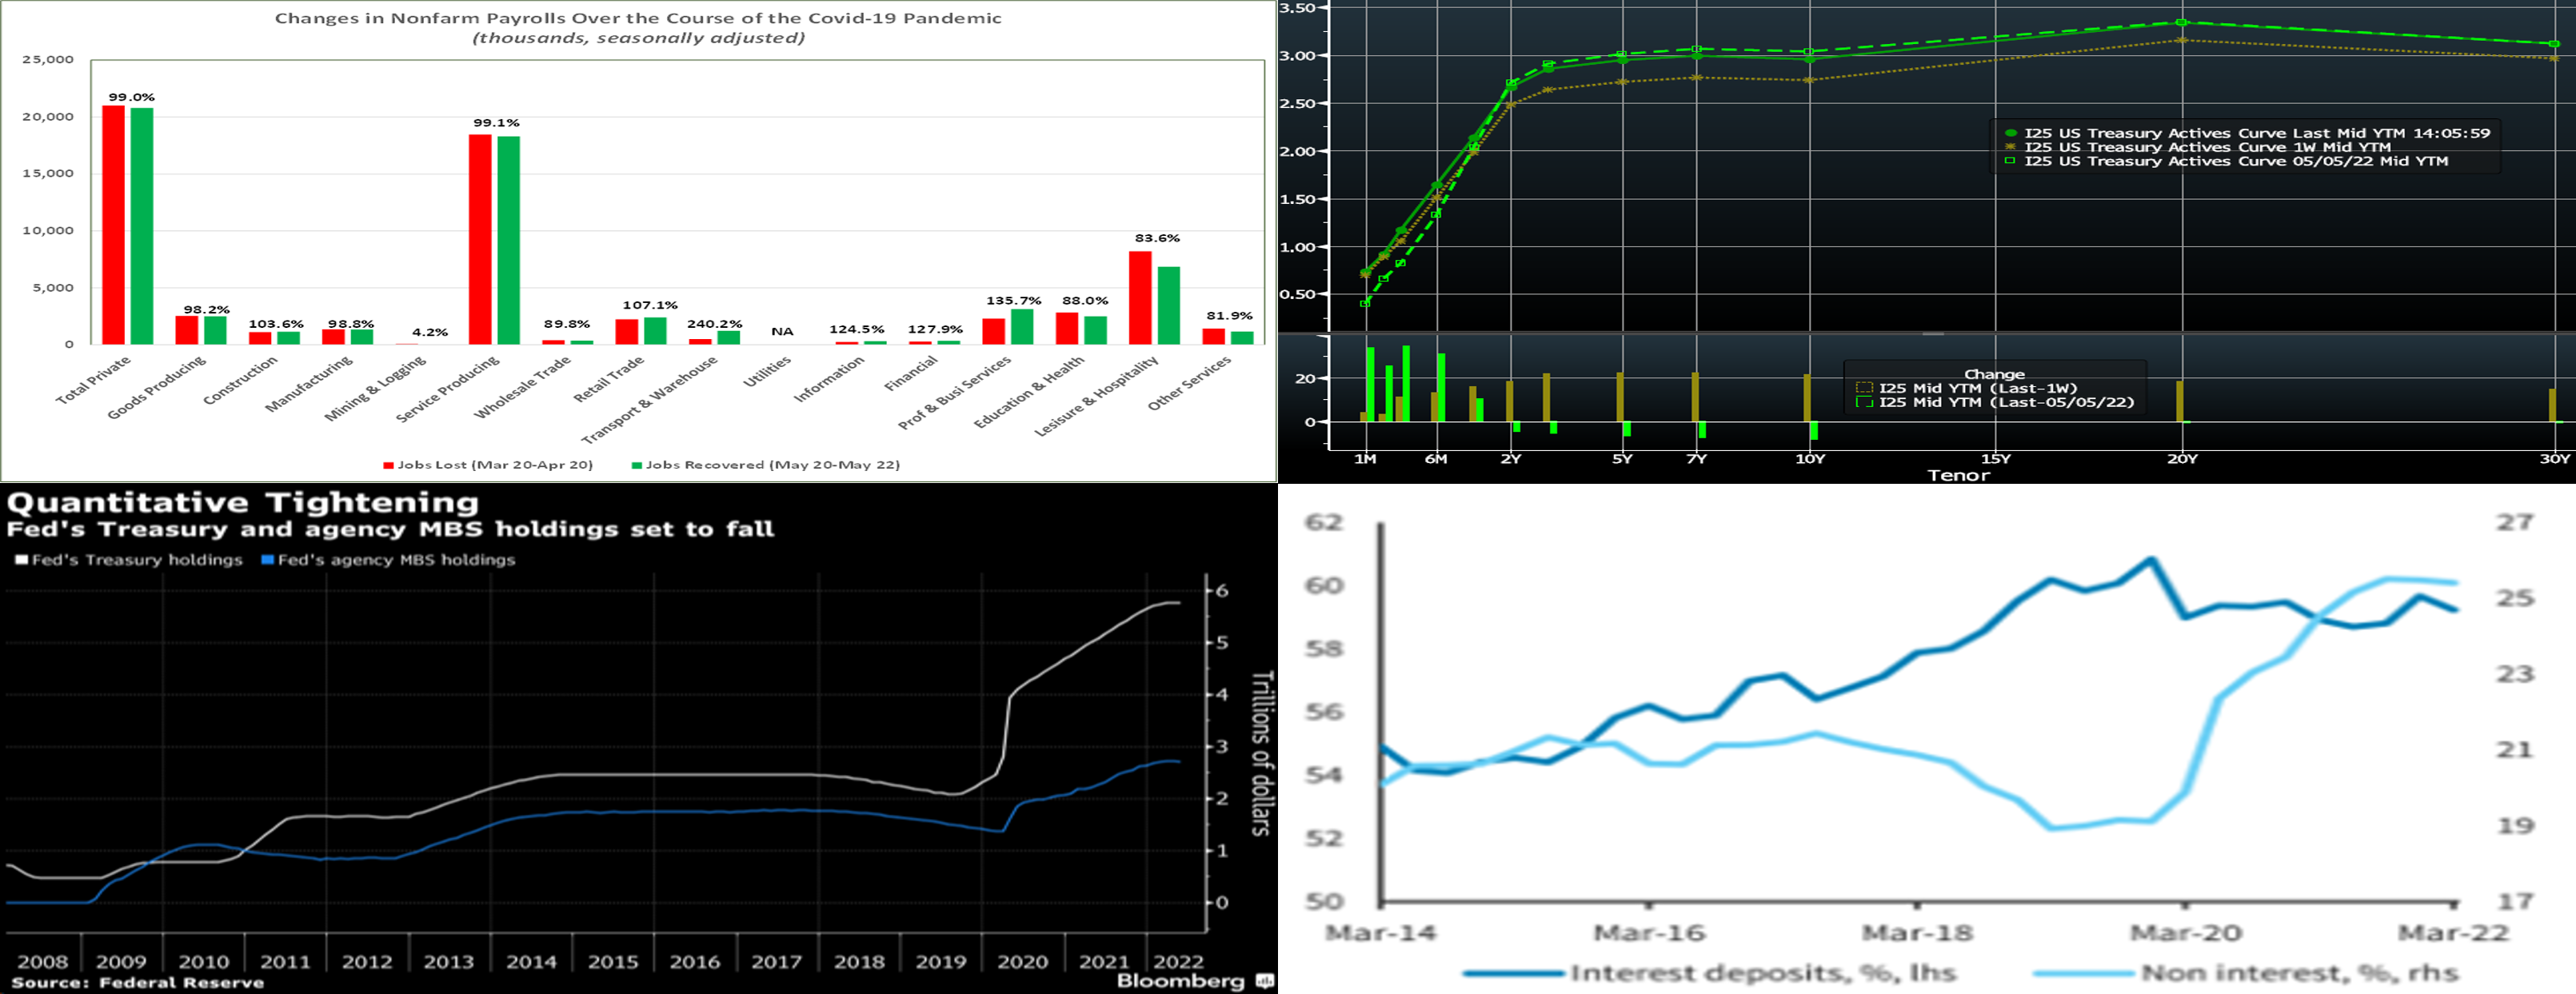
CHART 1 UPPER LEFT
Source: Bureau of Labor Statistics, FHLBNY. The BLS reported that nonfarm payrolls expanded by 390K in May, following revised increases of 436K in April and 398K in March. Last month’s gain was well above the 318K rise anticipated by the Street. Except the 61K net layoffs in retail trade, all major industry segments added to headcounts. Powered by increases in construction and manufacturing jobs, goods-producing payrolls climbed by 59K during the reference period, boosting the cumulative increase since April 2021 to 863K. Private service-producing hiring slowed in May, with net job creation at 274K, following average monthly gains of 422K over the January-April span. Leisure & hospitality, professional & business services, and education & health services accounted for all but a fraction of the rise in private service-producing jobs. Fueled by solid additions to state and local educational jobs, government payrolls expanded by 57K, after a 31K rise in April. To date 20.8mn, or 99%, of the 21mn private-sector jobs lost over the March-April 2020 span have been recovered. Moreover, payrolls in many private service-producing industries are now well above their pre-pandemic peaks.
CHART 2 UPPER RIGHT
Source: Bloomberg. Note: Top pane is yield (%), bottom pane is change (bps). As of Friday afternoon, yields were higher across the curve from the week prior. The 3 to 10-year sector led the move, rising ~22 bps. As seen in the chart, intermediate and longer yields are still a bit lower than post the May 4 FOMC meeting, and so this week’s move was essentially a retracement of the declines of recent weeks. Various Fed governors provided hawkish comments during the week, highlighted by Vice-Chair Brainard’s statement that she does not foresee a pause in rate hikes at the September FOMC, following the 50bps hikes expected in June and July. Also contributing to higher yields was a mid-week data print from Europe reflecting high inflation which basically served as a reminder of the global and still challenging nature of inflationary forces. In this vein, the market will pay close attention to the upcoming CPI data on Friday. The market remains volatile, albeit notably less so than a month ago, and so we continue to encourage members to engage with the desk for information and color.
CHART 3 LOWER LEFT
Source: Bloomberg. Shown here is the historical trend of the Fed’s securities holdings which recently exited the QE phase (Quantitative Easing: new buying of bonds, thereby adding cash to the financial system) of the last few years and the just-entered QT (Quantitative Tightening: no new buying, no re-investment, up to the stated cap amounts, of matured bonds’ proceeds). Having begun on June 1st, the Fed will allow up to $30bn in USTs and $17.5bn in MBS to mature every month without re-investing the proceeds. In this way, it will shrink its holdings passively, or by attrition. Note that, since none of the Fed’s UST holdings mature until June 15th, this process truly takes effect then. Beginning in September, it will allow $60bn USTs and $35bn MBS to run off its portfolio. The timeline of the runoff is uncertain, but projections by the NY Fed suggest that it could be consistent with allowing holdings to decline to ~$6 trillion in mid-2025, thereby totaling a decline of ~$2.5trn. The economy’s direction will also shape the endgame, as the Fed could halt the runoff sooner if the economy slows markedly and/or policy switches from rate hikes to easing in the next few years.
CHART 4 LOWER RIGHT
Source: FDIC, Barclays Research. The runoff strategy outlined above parallels that used by the Fed to shrink its holdings between October 2017 and July 2019, although the amounts of securities that will be running off the Fed’s portfolio this round are larger. A key and basic takeaway about QT is that the Fed essentially will “take back” from the financial system the cash that it had previously created via QE. If the Fed is not buying bonds issued by the US Treasury, then someone else must step in as the buyer. Bank deposits could experience impacts. Depicted here is the share (%) of banks’ interest (LHS) and non-interest (RHS) deposits of total liabilities. As can be seen, a shrinkage in non-interest-bearing deposits occurred after the start of QT in Q4-2017. Impacts from QT are likely to take time to unfold, especially given that it is an unwinding of an enormous liquidity infusion in recent years.
FHLBNY Advance Rates Observations
Front-End Rates
- Short-end Advance rates finished higher by 2 to 10 bps week-over-week, with 2-month and further leading the move. Short-end market flows have been volatile in recent weeks, thereby leading to dynamic intraday and day-to-day moves in rates. Meanwhile, the market’s pricing of near-term Fed rate hikes continues to trend advance rates higher. As of this past Friday midday, the market priced for a cumulative 100 bps of hikes for the next two FOMC meetings on June 15th and July 27th. This pricing, and the fact that maturities are crossing further into the timeline of the Fed hiking cycle, contributed to the moves.
- Given the Fed tightening posture and upcoming FOMC meetings, rates will remain highly responsive to the market’s moves and pricing of the Fed.
Term Rates
- Longer-term rates finished higher, week-over-week, mirroring the move in the UST market. While 1-year was ~11 bps higher, the 2 to 10-year sector was ~20 to 23 bps higher on the week. Kindly refer to the previous section for relevant market color.
- On the UST term supply front, this upcoming week brings 3/10/30-year auctions. With a light economic data calendar and the Fed in blackout mode before the June 14/15th FOMC, markets may trade in a narrower range in eager anticipation of Friday’s CPI release. Please call the Member Service Desk for information on market dynamics, rate levels, or products.
Product Alert: FHLBNY is pleased to announce enhancements to our Advance Rebate Program, which provides members an opportunity to receive a cash rebate when prepaying an eligible advance and rebooking a new advance within a 30-day period. Rebate-eligible advances now must have a minimum of 6-months (reduced from 1-year) remaining. Moreover, the potential cash rebate has been increased. This program can be suitable for those wishing to extend their liability duration and/or potentially improve net interest margin. Please call the Member Service Desk at (212) 441-6600 for more information.
Forward Start Advance (FSA): For members with upcoming borrowing or refunding plans, consider the FSA as a method to opportunistically “lock in” rates before advance settlement date. Please call the Member Service Desk at (212) 441-6600 for more information.
The Symmetrical Prepayment Advance Feature
With rates at or near multi-year lows, it is a compelling juncture to use the SPA feature on term advances. This feature allows member to capture, at prepayment, changes in the Fair Value of the advance which are favorable to the member. Contact us to discuss.
Looking for more information on the above topics? We’d love to speak with you!
Questions?
If you wish to receive the MSD Weekly Market Update in .pdf format (includes FHLBNY rate charts) or to discuss this content further, please email the MSD Team.