Member Services Desk
Weekly Market Update
Economist Views
Click to expand the below image.

Eager for clues to the magnitude of the summer-quarter rebound in business activity, the attention of market participants will return to the economic release calendar this week. As usual, the Bureau of Labor Statistics’ (BLS) update on the employment situation will enjoy pride of place. Nonfarm payrolls are expected to expand by 1.5 million in August, with the civilian unemployment rate retreating from 10.2% in July to 9.9%. Construction, manufacturing, and spending gauges are also expected to improve in their respective reporting periods. If recent data are reliable guides, a series of positive surprises could be in the offing in this week’s reports. In the wake of the Federal Reserve’s updated Statement on Longer-Run Goals and Monetary Policy Strategy, traders and investors may also pay unusual attention to the upcoming slate of policymaker appearances.
Construction Spending: The nominal value of new construction put-in-place likely rose in July, stemming the pandemic-induced 6.0% decline reported over the March-June span.
ISM Manufacturing PMI: Available national and regional canvasses suggest that the Institute for Supply Management’s (ISM) factory activity barometer moved deeper into expansionary territory in August, thereby improving on July’s 54.2% reading.
Motor Vehicle Sales: Industry experts expect passenger car and light truck sales to record a seasonally adjusted annual rate near 15mn vehicles in August, up from 14.5mn in July and the highest since the 16.8mn posted before the shuttering of the economy in March.
ADP National Employment Report: Reported declines in initial and continuing jobless claims between the August and July survey periods suggest that over one million private sector jobs were added this month. Be on the lookout for a significant upward adjustment to ADP’s July estimate in this week’s report, as last month’s ADP projection of a 167K increase in private-sector jobs was well below the 1.76mn in the BLS’ report.
ISM Non-Manufacturing Activity Index: Regional soundings suggest that service-sector activity expanded for a third straight month, albeit at a slightly slower pace than in July. The headline measure likely will retreat to 56.5 in August from the 58.1 in the previous month.
Employment Situation Report: Nonfarm payrolls likely expanded for a fourth straight month in August, with a variety of indicators suggesting that the median Street forecast for a 1.5mn gain is too low. The reduction in the state insured unemployment rate, from 11.6% during the July survey period to 9.9% in August, points to a meaningful move in the civilian jobless measure into single-digit territory from 10.2% last month.
Federal Reserve Appearances:
Aug. 31: Federal Reserve Vice Chair Richard Clarida will take part in a virtual discussion of U.S. monetary policy, hosted by the Petersen Institute for International Economics.
Aug. 31: Atlanta Fed President Raphael Bostic will participate in a virtual conversation about philanthropy and an inclusive recovery, hosted by the Florida Philanthropic Network.
Sept 1: Fed Governor Lael Brainard will take part in a virtual discussion of the outlook, hosted by the Brookings Institution.
Sept 2: Cleveland Fed President Loretta Mester to discuss U.S. Outlook and Monetary Policy.
Sept 2: Federal Reserve Beige Book to be released.
Sept 3: Chicago Fed President Charles Evans to discuss economy and monetary policy in a virtual event hosted by the Lakeshore Chamber of Commerce.
Click to expand the below images.
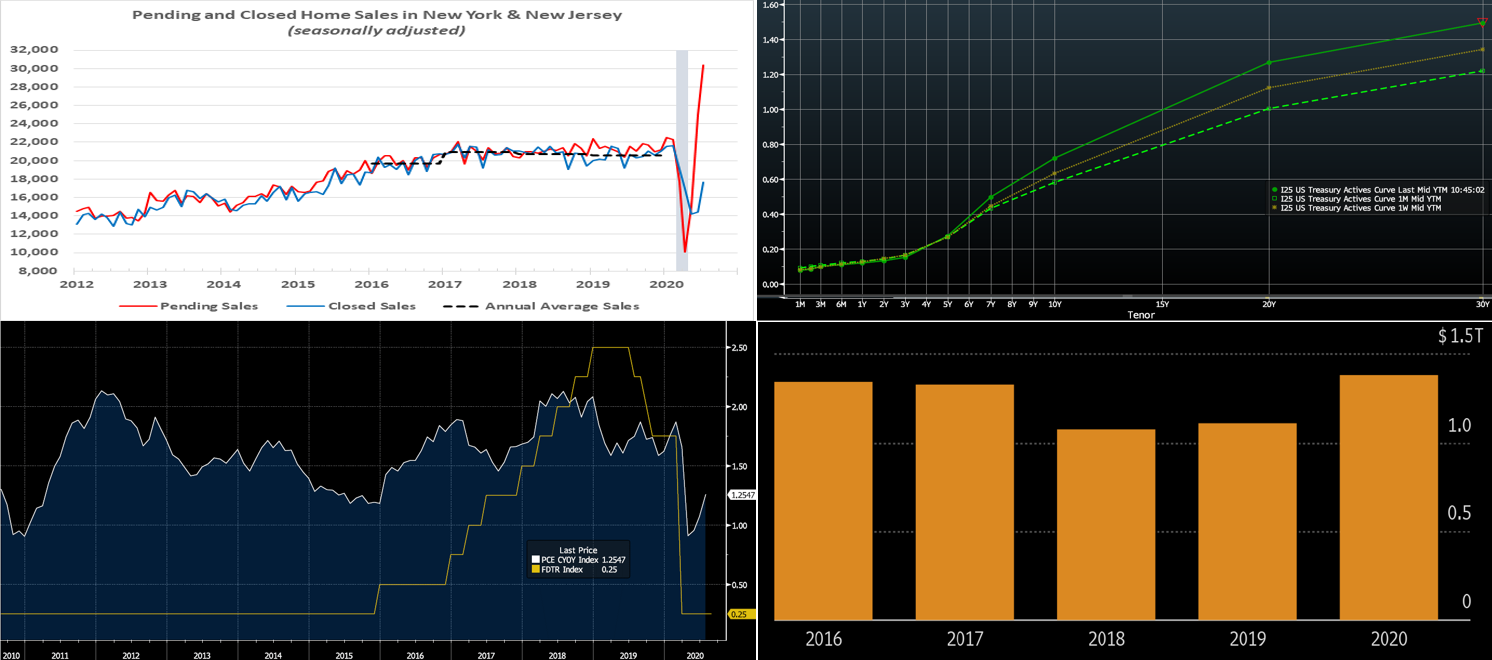
CHART 1 – UPPER LEFT
Source: FHLBNY; NYS Association of Realtors; NJ Realtors. In data released this past week, home-purchase contract signings rocketed higher in the FHLBNY coverage area since April and pointed to an impending and powerful increase in existing home sales. Mortgage rates near all-time record lows and a bounce-back in activity from early spring have inspired the spike. The Bankrate.com National Mortgage Rate Index currently sits at 3.12%, up from 3.01% a week ago; however, sub-3% rates are achievable in the market. Also boosting activity are demographic and geographic trends of people moving from the city to the suburbs, in addition to increased second/vacation home activity.
CHART 2 – UPPER RIGHT
Source: Bloomberg. In yet another partial reversal of the prior week, the UST yield curve “bear steepened” this past week. The main impetus to the move was Fed Chairman Powell’s Thursday speech on changes in the FOMC’s Statement on Longer-Run Goals and Monetary Policy Strategy. The Chairman emphasized a flexible average inflation targeting approach. He specifically noted that “following periods when inflation has been running below 2%, appropriate monetary policy will likely aim to achieve inflation moderately above 2% for some time”. As has been the case in recent months, the Fed’s guidance and programs have served to pin the shorter (5-year and in) portion of the curve in a tight range, and so it has been the longer end of the curve leading any moves. Following this script, and in reaction to the news of the Fed trying (even harder!) to generate inflation, the portion of the curve past 5-year incorporated more inflation term premium and thereby pushed upward.
CHART 3 – LOWER LEFT
Source: Bloomberg. This chart portrays the Fed’s preferred measure of inflation, namely the monthly PCE (Personal Consumption Expenditure) Core Price Deflator Index Year-on-Year, versus the Fed Funds Target Rate Upper Bound. The latest PCE measure was announced at ~1.3% on Friday morning. Given that it is well below 2% and that the Fed kept rates steady in prior years when this measure flirted with 2%, it is understandable that the market currently prices for no change in rates over the next few years.
CHART 4 – LOWER RIGHT
Source: Bloomberg. New Investment Grade bond issuance has now eclipsed the annual tallies of the last few years and is on pace to further extend its already record annual amount. Normally a slower month, the tally thus far in August is a record monthly amount of $136bn. This issuance has placed some steepening pressure on the yield curve, as sizable amounts of it have been in maturities of 5-year and beyond. The rock-bottom rates climate has generated an insatiable thirst for yield among investors, and large corporates have been ready and willing to quench it.
FHLBNY Advance Rates Observations
Front-End Rates
Short-end advance rates finished 1 to 2 bps higher week-over-week, thereby partially reversing the prior week’s downward move. Heavy T-bill issuance was a feature, as usual, but net supply has been slowing and thereby allowing for easier market absorption. Government-only (G.O.) and Prime MMF AUM experienced ~$4bn of outflows on the week, thereby somewhat sapping demand. Vanguard announced the conversion in September of a $125bn Prime fund to G.O. This move deserves attention; if more funds follow suit, the potential exists for increased demand for T-bills and Agency paper and some upward pressure on Libor, all else equal.
Heavy T-Bill issuance will remain a theme; UST issuance overall is now net positive supply in that more is being issued than what the Fed is buying in its programs, and so this scenario could prove a small challenge. However, with short UST rates at rock-bottom levels, and the Fed likely on hold for a long period, rates may trade in a sideways pattern. Net T-bill issuance is forecast by Street dealers to notably slow in the months ahead, and Treasury has announced plans to shift issuance out the curve, but a new fiscal relief package may complicate/alter this forecast.
Term Rates
Medium and longer-term advance rates were unchanged to 7 bps higher, week-over-week, in a “bear steepener” shift. While rates were mostly unchanged sub-5-year, they were 2 to 7 bps higher in progressive fashion in the 6 to 10-year space. See the previous section for more context on the move.
The upcoming week brings a reprieve in term UST auctions. Per color in the previous section, a few corporates may take an early stab at issuance before the holiday weekend. Attention will remain on the prospects of further relief legislation and certainly also on COVID-19 and the question of whether or not it is being managed effectively enough to avoid any pauses in reopening. Employment data on Thursday/Friday will highlight economic news.
The Symmetrical Prepayment Advance Feature
With rates at or near multi-year lows, it is a compelling juncture to use the SPA feature on term advances. This feature allows member to capture, at prepayment, changes in the Fair Value of the advance which are favorable to the member. Contact us to discuss.
Looking for more information on the above topics? We’d love to speak with you!
Questions?
If you wish to receive the MSD Weekly Market Update in .pdf format (includes FHLBNY rate charts) or to discuss this content further, please email the
MSD Team.
Special Member Alert
The FHLBNY recently announced a newly expanded and flexible Disaster Relief Funding (DRF) advance program which offers discounted rate advances with maturities 1-mo and greater. Additionally, we have announced that PPP loans will be accepted as eligible collateral. Please contact us with any questions.
Disclaimer: Notwithstanding any language to the contrary, nothing contained in these disclosures is intended to constitute an offer, inducement, promise, or contract of any kind. Any product descriptions and pricing may be subject to change without notice.
The content provided in these disclosures is presented as a courtesy to be used only for informational purposes and is not represented to be error free. The FHLBNY makes no representations or warranties of any kind with respect to the content contained herein, such representations and warranties being expressly disclaimed. The FHLBNY is not a financial or investment advisor.
Moreover, the FHLBNY does not represent or warrant that the content of these disclosures is accurate, complete or current for any specific or particular purpose or application. It is not intended to provide nor should anyone consider that it provides legal, accounting, tax or other advice. Such advice should only be rendered in reference to the particular facts and circumstances appropriate to each situation. The FHLBNY encourages you to contact appropriate professional(s) and consultant(s) to assess your specific needs and circumstances and to render such advice accordingly. In addition, the FHLBNY is not endorsing or recommending the use of the means or methods contained in or through these disclosures for any special or particular purpose.
It is solely your responsibility to evaluate the risks or merits of any funding or investment strategy. In no event will FHLBNY or any of its officers, directors or employees be liable for any damages — whether direct, indirect, special, general, consequential, for alleged lost profits, or otherwise – that might result from any use of or reliance on these materials.