Member Services Desk
Weekly Market Update
This MSD Weekly Market Update reflects information for the week of October 24, 2022.
Economist Views
Click to expand the below image.
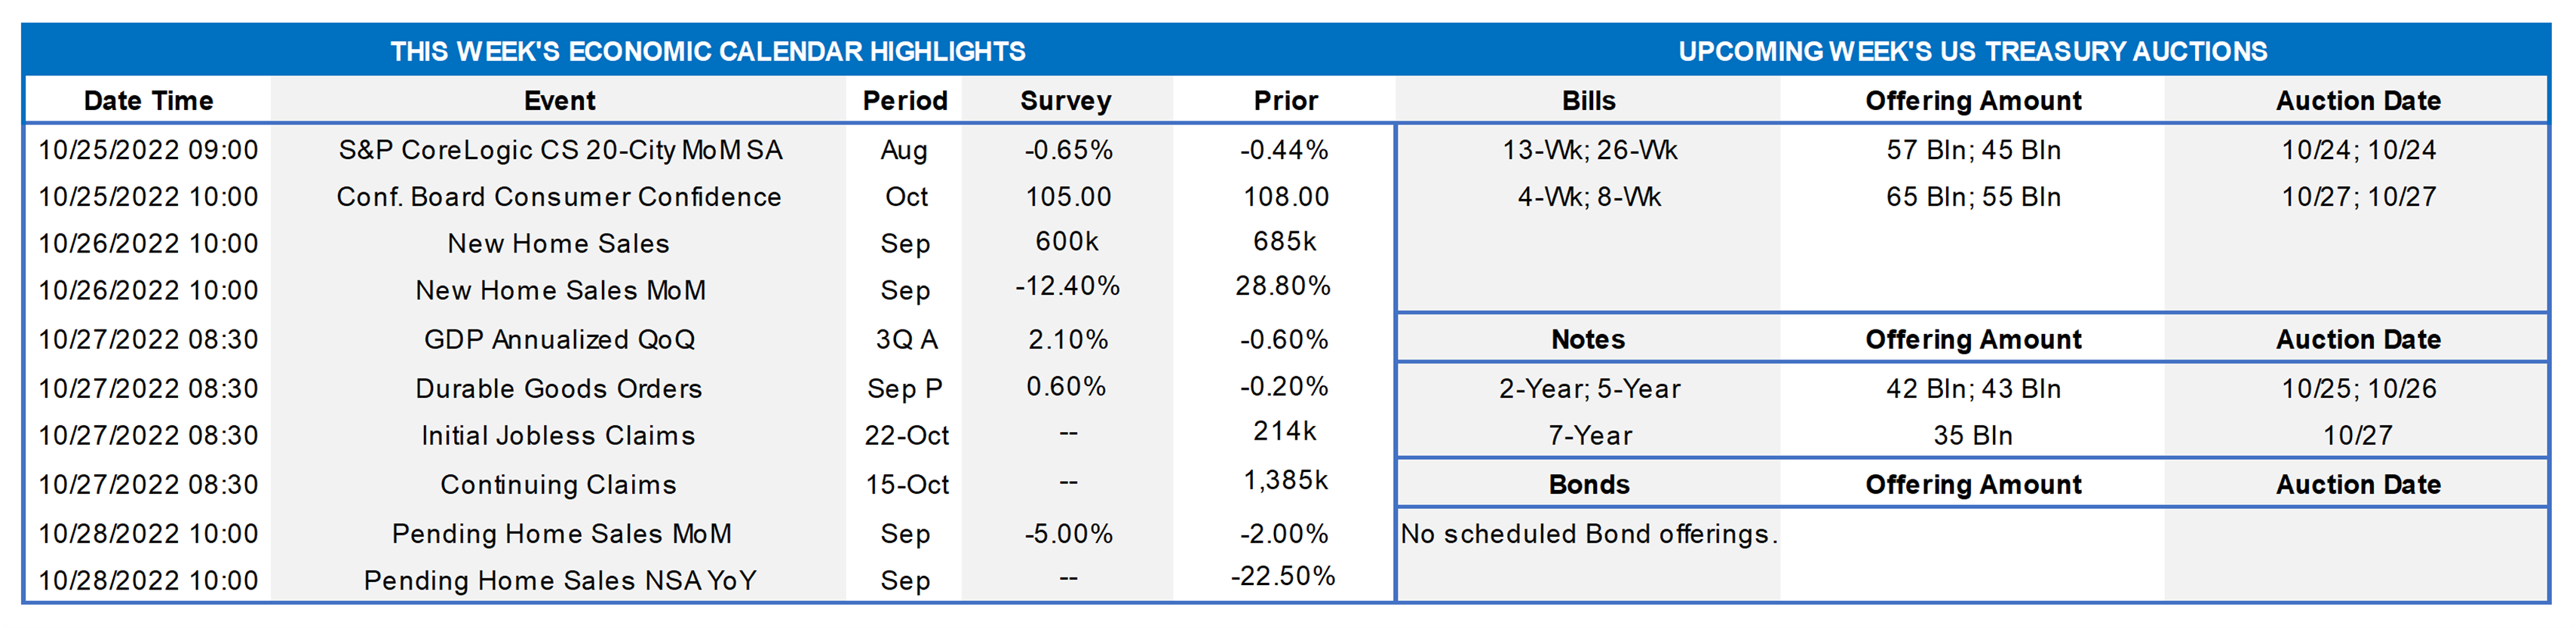
With monetary policymakers observing the traditional quiet period ahead of next week’s Federal Open Market Committee meeting, the attentions of market participants will focus on the economic release calendar. Buckling under the weight of recent surges in mortgage interest rates, fresh data releases on home prices, new-dwelling sales, and purchase-contract signings are all expected to decline from their respective prior-period levels. By contrast, consumer confidence and durable goods orders likely witnessed modest gains. Jobless claims probably remained in recent ranges, consistent with a 250K-300K increase in nonfarm payrolls and no change in the unemployment rate from 3.5% in the Bureau of Labor Statistics’ October report. The Bureau of Economic Analysis’ first pass at aggregate summer-quarter activity could have the largest impact on the market’s expectations for the prospective path of the federal funds rate. The median Street call for a 2.1% annualized rebound in real GDP in Q3, if realized, would support the view that the Fed will continue to raise administered rates to slow demand and inflation.
S&P CoreLogic Case-Shiller (SPCLCS) 20-City Home Price Index: Home prices probably retreated for a second consecutive month across the twenty major metropolitan areas canvassed by SPCLCS in August. The .7% decline implied by available reports, after a .4% dip in July, would still place home selling prices 14.2% above those recorded 12 months earlier.
Conference Board Consumer Confidence: Buoyed by solid labor-market conditions, this sentiment gauge probably climbed to a six-month high of 108.5 in October from 108 in September.
Merchandise Trade Deficit: The shortfall on international trade in goods is expected to have widened by $600mn to $87.9bn in September.
New Home Sales: Reported pullbacks in the numbers of single-family dwellings started and building permits issued suggest that new home sales declined by 5.5% to a seasonally adjusted annual rate of 650K in September, erasing almost one quarter of the 28.8% leap posted in August.
Jobless Claims: New claims for unemployment insurance benefits likely remained in a historically low 210-230K range during the week ended October 22. Continuing claims probably clocked in below the 1.4mn mark for a sixth straight week during the period ended October 15, supporting the view that recently furloughed employees are having little trouble finding work.
Durable Goods Orders: Powered by an aircraft-led rebound in transportation equipment bookings, durable goods orders probably climbed by .6% in September, erasing the modest .2% dip recorded in the previous month. Excluding the anticipated rise in transport requisitions, “hard goods” bookings likely were unchanged, following a .3% gain in August.
Real GDP Growth: The Bureau of Economic Analysis’ first pass at summer-quarter activity is expected to show that growth resumed after a pair of modest declines during the winter and spring. While the median Street forecast calls for a 2.1% annualized gain, the range of available estimates is extremely wide, extending from a 1.0% increase to an above-trend 3.0% rise. Key inflation gauges likely slowed on an annualized basis from those witnessed in Q2.
Pending Home Sales: Contract signings likely fell for a fourth straight month in September, placing the National Association of Realtors’ pending sales gauge at its lowest level since the height of the pandemic in April 2020.
Federal Reserve Appearances: Federal Reserve officials to observe the traditional blackout period ahead of the November 1-2 FOMC meeting.
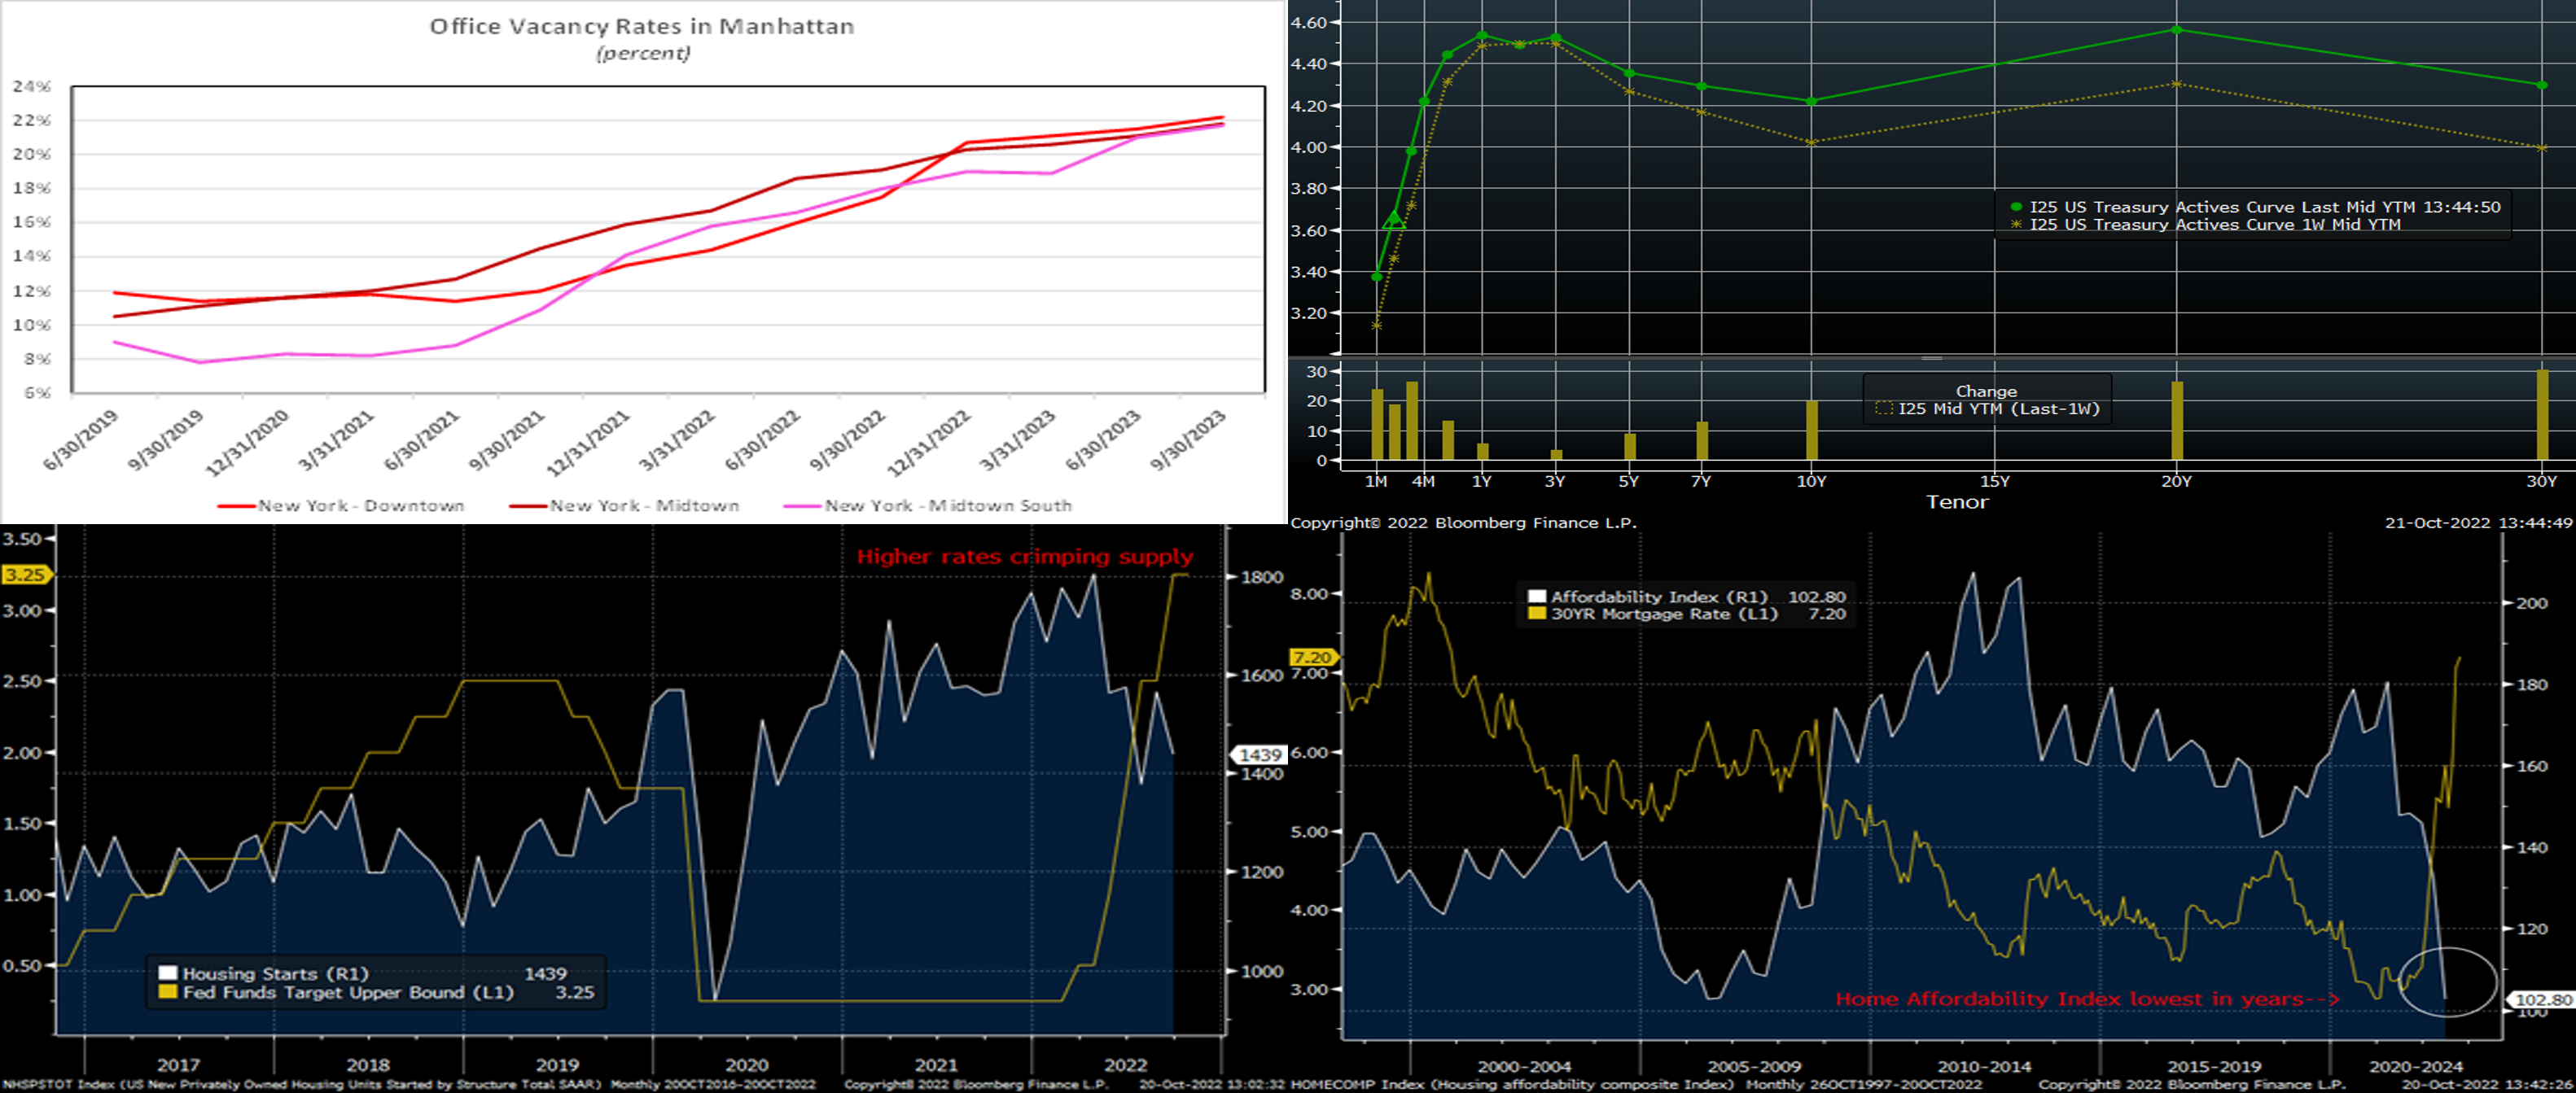
CHART 1 UPPER LEFT
Source: Cushman & Wakefield; FHLBNY. Here is a snapshot of the current NYC commercial real estate backdrop. Demand for office space in Manhattan remained weak during the summer quarter. Indeed, net absorption of office space fell by a little over 1.9mn square feet over the July-September span, thereby boosting the cumulative falloff since the pandemic began to a staggering 34.8mn. As seen here and predictably, office vacancy rates in the downtown, midtown and midtown-south areas have all moved higher. At 22% on average, rates stand well above the pre-pandemic 10.5% mean.
CHART 2 UPPER RIGHT
Source: Bloomberg. Note: Top pane is yield (%), bottom pane is change (bps). The UST curve, as of Friday midday, finished higher yet again from the week prior, with very short-end and 5-year-and-out tenors leading the move. This week marked the 12th straight week-over-week increase in the 10-year yield, thereby setting the longest such streak since the 1980’s. This past Friday morning illuminated why we often refer to “Fed-speak”, as FRB San Francisco President Daly said that policymakers should start planning for a reduction in the size of rate increases, albeit it is not yet time to “step down” from large hikes. While not shocking , her comments and some similar Fed-centric news reports nonetheless inspired a significant curve steepening, with the 2-year moving ~12 bps lower and the 30-year ~8 bps higher. These developments also led the market to somewhat pull back on Fed hike pricing past the November 2 FOMC; please see comments on our next slide for details. We continue to encourage members to engage with the desk for rate updates and product information, especially as our advance rates are influenced by, and dynamically move with market rates.
CHART 3 LOWER LEFT
Source: Bloomberg. Shown here is a historical view of US new privately owned housing unit starts (RHS, white, 1000s, via US Census Bureau) vs. the Upper Bound of the Fed Funds Target rate range (LHS, gold, %). This year’s Fed hiking cycle and dramatic rise in the yield curve has clearly put a crimp in housing starts and changed the tone of the housing sector. The Fed’s goal has been to tighten financial conditions, in order to quell inflationary forces, and so these developments may be welcome to it. But, in the longer term, lower starts/supply can exacerbate housing shortage issues/problems and thereby exert upward pressure on prices, rents, and, ultimately, the inflationary forces it is trying to now quell. Perhaps these dynamics will play a part in the Fed’s eventual tapering of its tightening cycle. On a positive note, multi-family unit permits/construction have thus far held up much better than single-family.
CHART 4 LOWER RIGHT
Source: Bloomberg. Depicted here is the National Association of Realtors Housing Affordability Index (RHS, white) vs. Bankrate.com’s US Home Mortgage 30-year Fixed Rate National Average index. Unsurprisingly, this year’s increase in rates has also put a crimp, to put it mildly, in home affordability metrics. The severe dip in affordability is clear here, and home sales volumes and prices are experiencing downward pressures as a result. The FHLB-NY and its members can combat some of these affordability challenges. Each year since 1990, FHLB-NY has contributed 10% of its income to the Affordable Housing Program (AHP). This program subsidizes long-term financing for very low-, low-, and moderate-income families. We also offer Community Lending Programs (discounted advances) and the Homebuyer Dream Program® (HDP®), a grant program for first-time homebuyers; to learn more, please visit our community page.
FHLBNY Advance Rates Observations
Front-End Rates
- Short-end rates again finished higher week-over-week, with 1-month-and-out tenors up by 14 to 20 bps. The 3-week finished a notable 34 bps higher. Maturity dates are crossing deeper into the anticipated Fed hikes on November 2 and December 14. As of this past Friday midday, the market priced for a 100% chance of a 75 bps hike at the November 2 FOMC, with a 100% probability of a 50 bps and ~40% (slightly lower than last week’s 73%) chance of another 75 bps hike at the December 14 FOMC. For 2022 cumulatively from now, the market prices for ~135.5 bps (down 7.5 bps from last week) of hikes.
- Given the Fed’s tightening and data-dependent posture, rates will remain highly responsive to economic data.
Term Rates
- The longer-term curve finished higher and steeper from the week prior, generally mirroring the move in UST and swaps markets. While 2-year was a few bps higher, 5-year finished ~9 and 10-year ~ 23 bps higher. Kindly refer to the previous section for relevant market color. The advance curve remains inverted at various points, thereby offering opportunities to extend in advance duration for minimal or lower coupon cost. The flat curve and high implied volatility environment also can serve to make putable advances more compelling.
- On the UST term supply front, this upcoming week offers 2/5/7-year auctions. Market focus will remain on Fed-speak and the week’s economic data, particularly Friday’s PCE inflation-related figures. Please call the Member Service Desk for information on market dynamics, rate levels, or products.
Product Alert: FHLBNY is pleased to announce the reintroduction, after a temporary suspension owing to Libor-cessation, of the Putable Advance, Fixed-Rate with SOFR Cap Advance, and ARC with SOFR Cap/Floor Advance. The Callable Advance continues to be offered. This expansion of the product menu will provide members with more options and flexibility for the management of funding and/or hedging needs. Please call the Member Service Desk at (212) 441-6600 for more information.
Forward Start Advance (FSA): For members with upcoming borrowing or refunding plans, consider the FSA as a method to opportunistically “lock in” rates before advance settlement date. Please call the Member Service Desk at (212) 441-6600 for more information.
The Symmetrical Prepayment Advance Feature
For those anticipating term funding needs, and with rates on an uptrend, it can be an appropriate juncture to consider our SPA feature. This feature allows the member to capture, at prepayment, changes in the fair value of the advance which are favorable to the member. Contact Member Service Desk to discuss.
Looking for more information on the above topics? We’d love to speak with you!
Questions?
If you wish to receive the MSD Weekly Market Update in .pdf format (includes FHLBNY rate charts) or to discuss this content further, please email the MSD Team.