Member Services Desk
Weekly Market Update
This MSD Weekly Market Update reflects information for the week ending April 26, 2024.
Economist Views
Click to expand the below image.
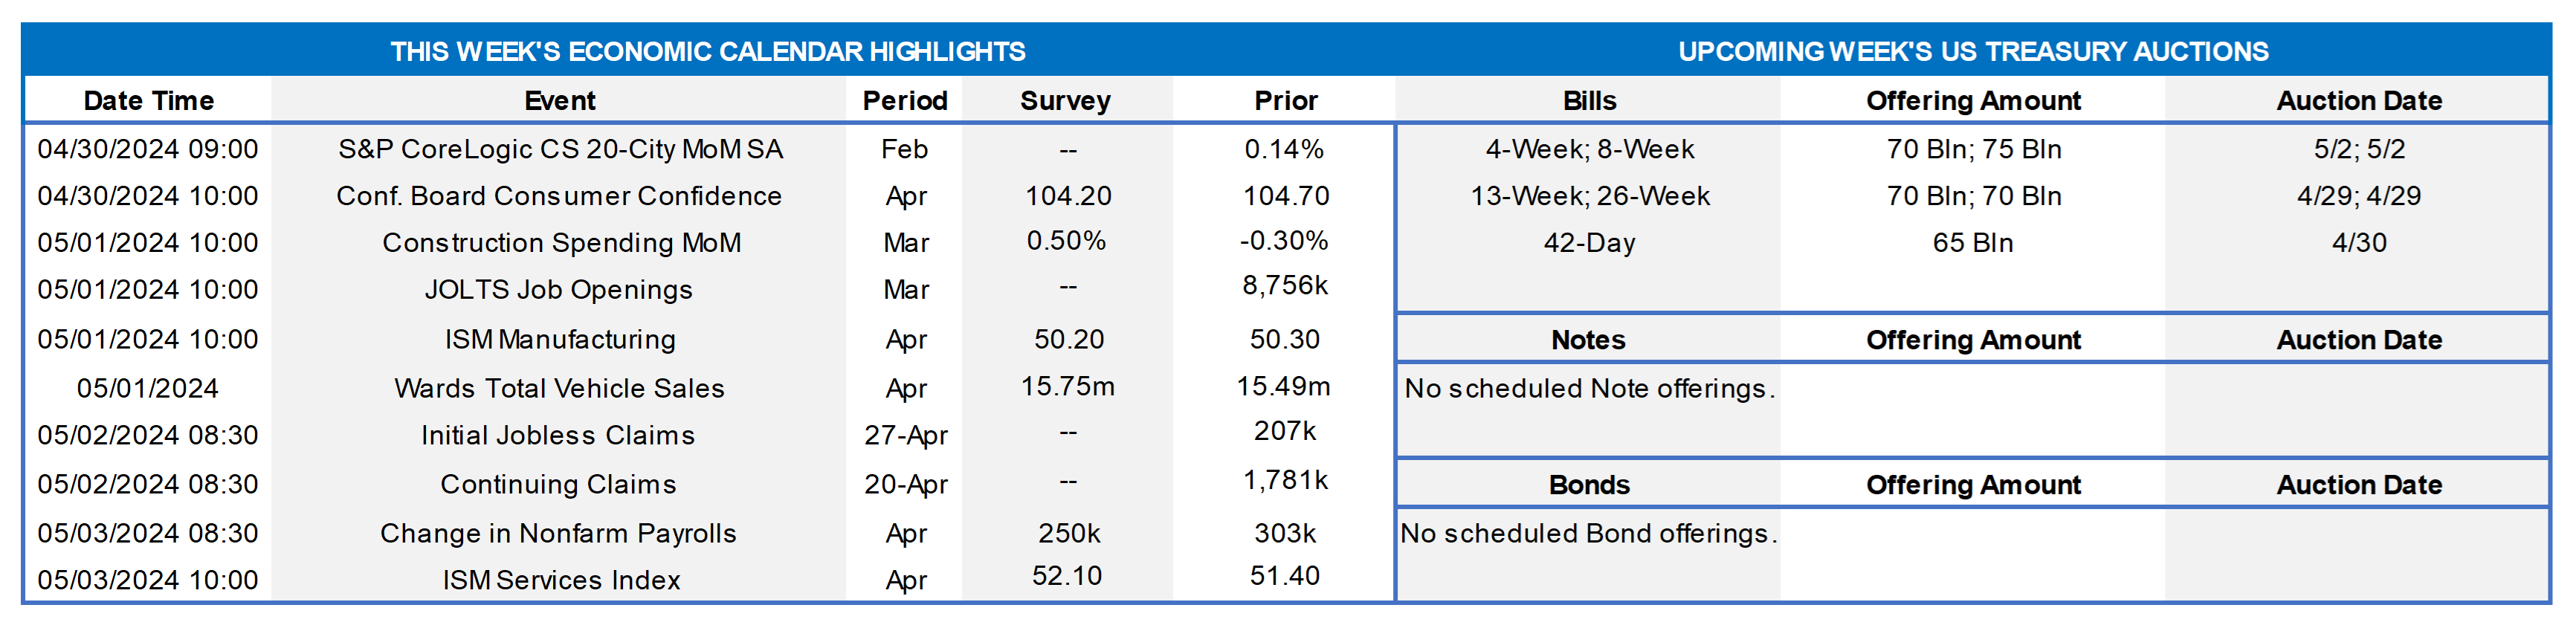
The Federal Open Market Committee (FOMC) meeting will be the marquee event of the upcoming week. Policymakers are expected to leave the Federal Funds rate target range unaltered at 5¼% to 5½%. The post-meeting communiqué likely will reiterate that activity has been expanding at a solid pace, job gains have remained strong, and the unemployment rate is low. The policy statement can be expected to repeat that inflation has eased over the past year but remains elevated. While the FOMC believes that the risks to achieving its employment and inflation goals are moving into better balance, members remain attentive to inflation risks. The FOMC will likely note that policymakers will carefully assess incoming data, the evolving outlook, and the balance of risks in considering any policy adjustments. Given recent reports on employment, prices, and retail sales, it is a virtual certainty that the statement will highlight that the FOMC does not expect it will be appropriate to reduce rates until it is more confident that inflation is moving sustainably toward the 2% goal. The FOMC will continue to roll off maturing UST and Agency and MBS. As there is no update to participants’ forecasts for the paths of the Fed Funds rate and key economic variables over the 2024-26 period until the June FOMC, Chair Powell’s post-meeting press conference will be closely scrutinized.
S&P CoreLogic Case Shiller (SPCLCS) 20-City Home Price Index: Home price increases probably quickened across the twenty major metropolitan areas canvassed by SPCLCS in February, rising by .4% after a modest .1% uptick in January. That projection, if realized, would place the SPCLCS barometer 7.1% above the level posted in February 2023.
Conference Board Consumer Confidence: Early-month data from the University of Michigan imply that this gauge climbed by 2.3 points to 107 in April, reversing one-third of the deterioration witnessed over the February-March span.
Construction Spending: The nominal value of new construction put-in-place is expected to have risen by .5% in March, erasing the decline recorded over the prior two months.
ISM Manufacturing Activity Index: Available canvasses suggest that nationwide activity expanded marginally in April, with the index little changed from the 50.3% posted in the prior month.
JOLTS Job Openings: A reported increase in online help-wanted postings suggests that nationwide job openings rose by 125K to a three-month high of 8.88mn in March. At an estimated 2.45mn, the excess of vacant positions nationwide would represent almost 1.4 jobs per unemployed person.
Unit Motor Vehicle Sales: Sales of light trucks and passenger cars probably remained on a saw-toothed path in April, rebounding by 2.6% to a seasonally adjusted annual rate of 15.9mn.
Employment Situation Report: Labor-market conditions probably remained tight in April. Nonfarm payrolls likely expanded by 275K last month, matching the average net job gain posted over the January-March span. Data on the state insured unemployment rate collected after the March household canvass period suggest that the civilian jobless gauge held steady at 3.8%. With the BLS’ collection period failing to include the 15th of the month, the rise in average hourly earnings during the reference period probably will register below the .3% gain anticipated by the Street.
ISM Services Activity Index: The expansion likely continued for a 16th consecutive month in April, although the breadth of gains may be little changed from the 51.4% reading witnessed in March.
Federal Reserve Appearances:
- May 1 Federal Open Market Committee Policy Statement followed by Chairman Powell’s press conference.
- May 3 Chicago Federal Reserve Bank President Goolsbee to participate in a panel discussion at the Hoover Institution.
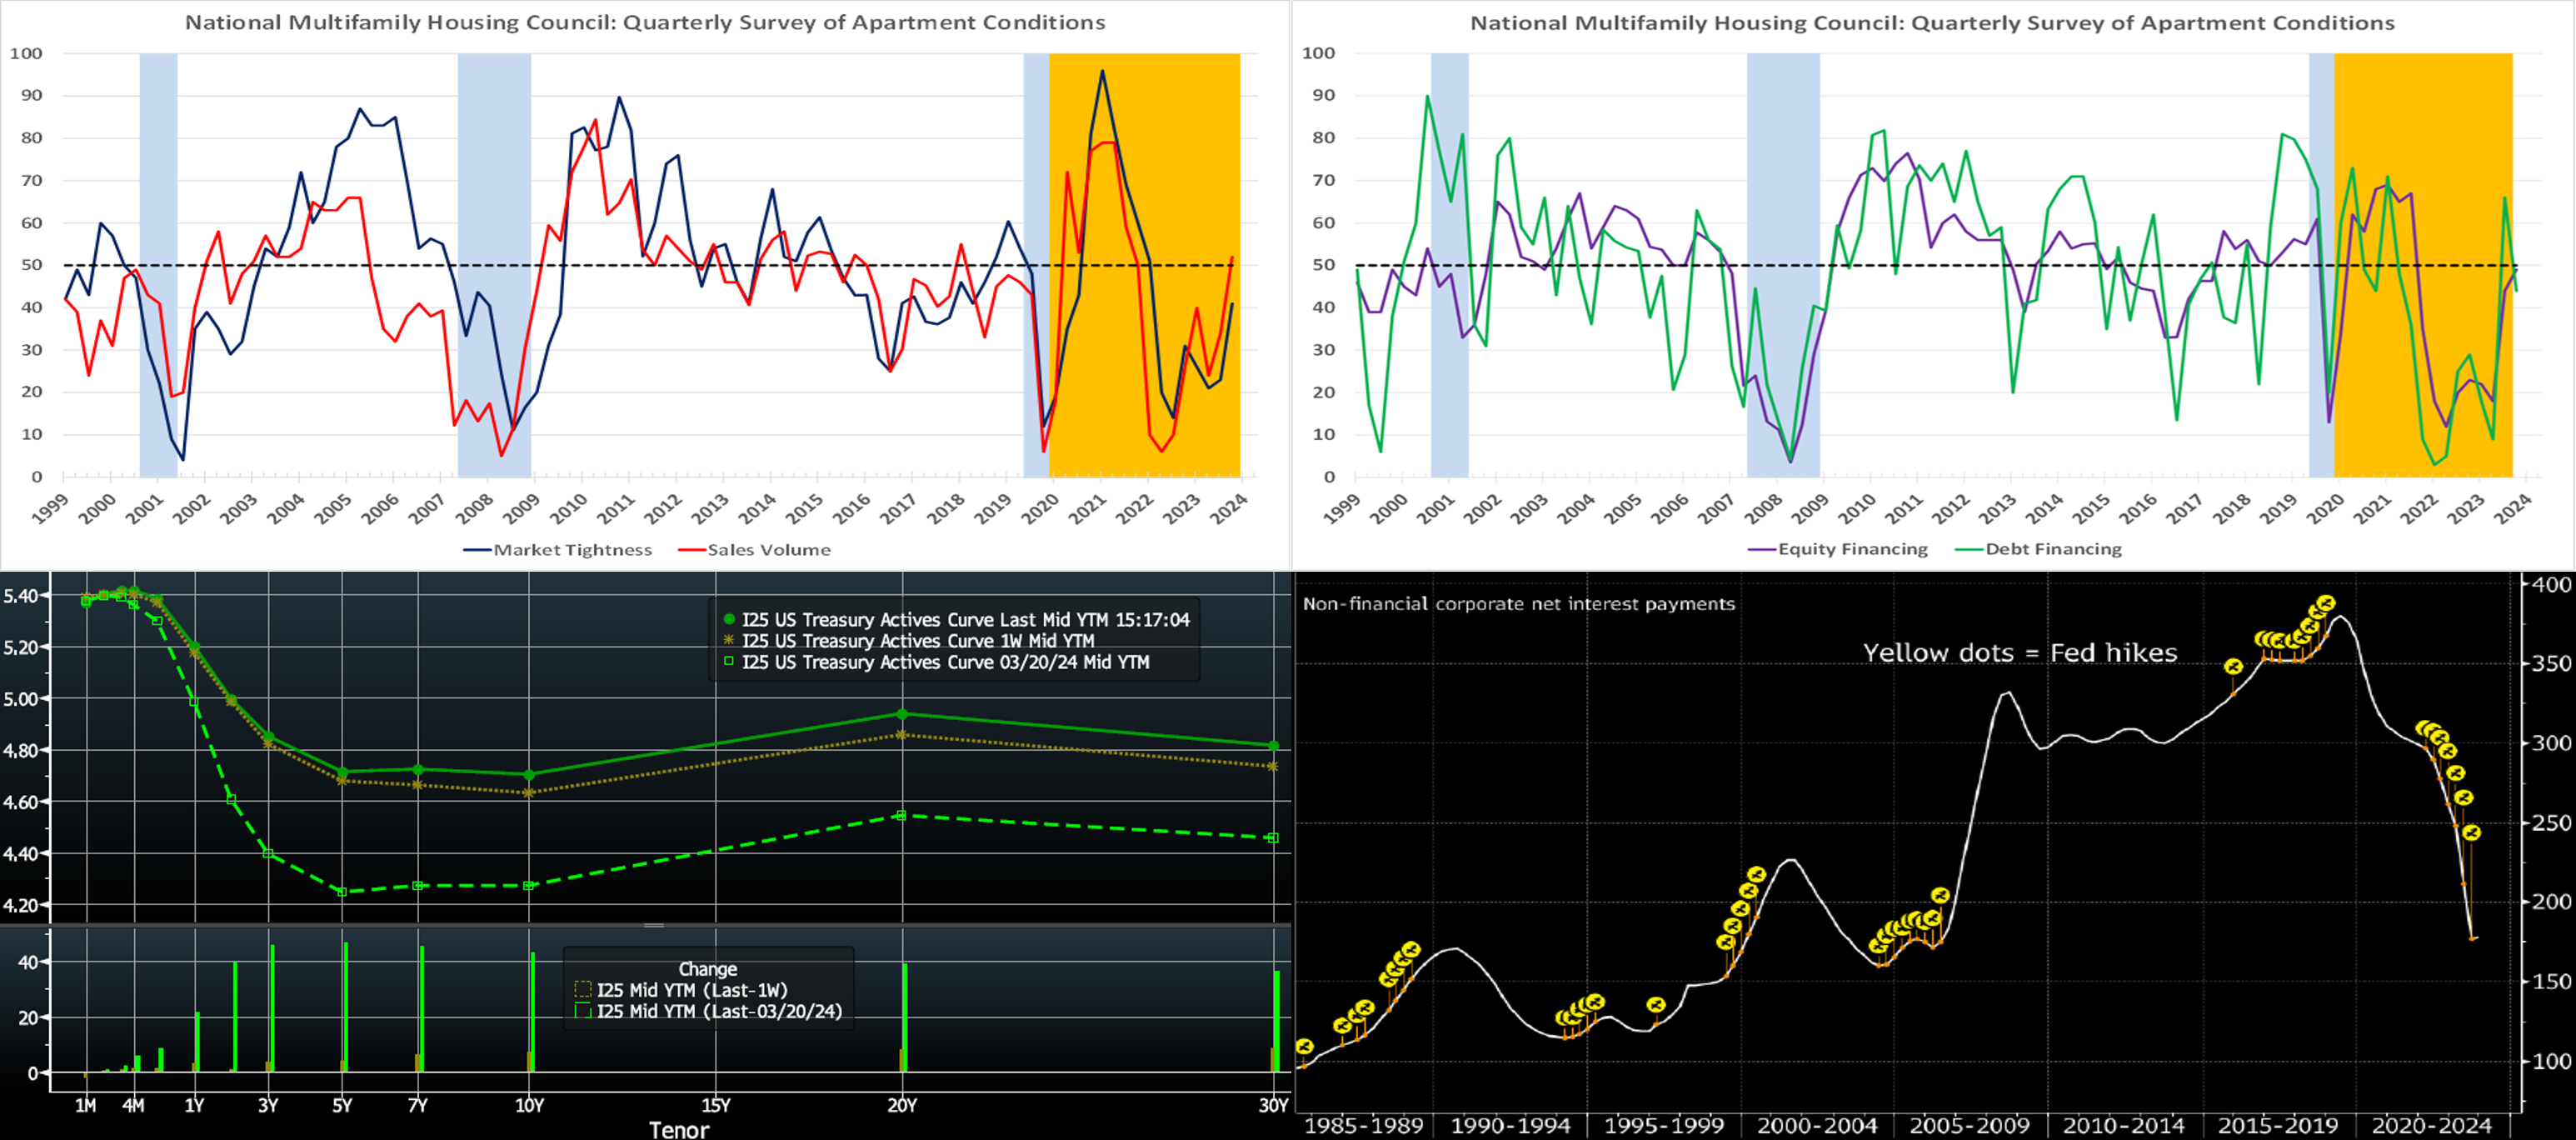
CHART 1 UPPER LEFT AND CHART 2 UPPER RIGHT
Source: National Multifamily Housing Council; National Bureau of Economic Research; FHLB-NY. Notes: These diffusion indices are calculated by taking one-half the difference between positive and negative responses and adding 50; blue-shaded areas denote recessions and orange-shaded areas highlight current expansion. Apartment market conditions continued to weaken in the National Multifamily Housing Council’s (NMHC’s) Quarterly Survey of Apartment Market Conditions for April 2024. Except for Sales Volume (52), which turned positive last quarter, the Market Tightness (41), Equity Financing (49), and Debt Financing (44) indexes all registered below the breakeven level. According to the NMHC, inflation has come in hotter than expected over the past few months – as the shelter component of CPI continues to lag moderating asking rents – which is expected to delay Federal Reserve rate cuts. The sharp rise in the rate on the 10-year UST has triggered a decrease in the availability of debt financing over the past three months. On the brighter side, however, this month’s survey results indicate that apartment sales volume has finally increased after seven consecutive quarterly declines. Moreover, the U.S. apartment market continues to absorb historic levels of new supply, resulting in rising vacancy rates and slower rent growth.
CHART 3 LOWER LEFT
Source: Bloomberg. Top pane is yield (LHS, %), bottom pane is change (LHS, bps). From last Thursday afternoon to this one, the UST curve again pushed modestly higher and steeper amidst record fresh UST supply. Adjusted for the roll to new on-the-run securities, the 2-year was ~2 bps higher, the 5-year ~4 bps higher, and the 10-year ~7 bps higher. The tone of Fedspeak, prior to this past week’s blackout period, had decidedly and consistently shifted to “in no rush to cut rates, need to see more data, and can keep rates steady as events evolve.” The past week’s economic data is likely to solidify that mantra for the upcoming FOMC meeting. In terms of market-implied pricing of the Fed, a full 100% probability of a 25 bps has now been pushed back from Fall to December, with the June 13th FOMC priced at only ~7% chance, down from ~13% last week. The August 1st FOMC is priced at ~30%, down from 43% last week, chance of the first 25 bps cut. The year-end 2024 forward is ~4.995%, or ~4.5 bps higher than last week, implying a cumulative total of ~33.5 bps of cuts by the end of this year.
CHART 4 LOWER RIGHT
Source: Bloomberg; Bureau of Economic Analysis. Likely a reason for the economy’s thus-far resilience in the rate-hike cycle is that not all areas of the economy have been hurt by higher rates, at least not yet. In turn, this dynamic is a reason why the Fed appears poised to remain on hold in a “higher-for-longer” policy stance on rates. A sizable portion of homeowners, for instance, are locked-in at lower-than–prevailing mortgage rates, and some are now earning more on savings. This dynamic can help underpin consumer spending. Meanwhile, many corporations, or at least corporations in aggregate, have experienced a decline in net interest payments over this hiking cycle. This dynamic is shown here (RHS, $bn, yellow dots denote Fed hikes) in the clear, and historically atypical, decline in the past few years of net interest payments by non-financial corporates. Some corporations, like homeowners, were able to secure low-cost funding during the “low rates” years. For instance, Apple Inc. issued a 40-year bond in July 2021 with a 2.85% coupon!
FHLBNY Advance Rates Observations
Front-End Rates
- Short-end rates moved higher by 1 to 3 bps week-over-week, with the 5- and 6-month tenors rising most. The move was spurred by Thursday’s economic data which led the market to pare back its pricing of potential Fed rate cuts this year. Net T-bill supply, after a long spell in positive territory and in timing with the upcoming Tax Day when Treasury receives cash inflows, has turned negative in recent weeks. This dynamic should continue for a few more weeks and, all else equal, can help tighten spreads on FHLB paper. But short-end markets will be most influenced by data and the market’s views on the Fed.
- Market focus will clearly steer to Wednesday’s FOMC outcome.
Term Rates
- The longer-term curve, week-on-week and generally mirroring moves in USTs and swaps, moved higher and steeper. While the 2-year rose ~1 bp, the 3-, 5-, and 10-year rose by, respectively, 3, 4 and 8 bps. Please refer to the previous section for color.
- On the UST term supply front, the upcoming week serves a welcome reprieve from new auctions. Note that UST auctions usually occur at 1pm and can occasionally spur volatility around that time. Please contact the Member Services Desk for further information on market dynamics, rate levels, or products.
The FHLBNY is pleased to announce the 2024 0% Development Advance (ZDA) Program, now available with a new streamlined submission process. This program provides members with subsidized funding in the form of interest rate credits to assist in originating loans or purchasing loans/investments that meet the eligibility criteria under the Business Development Advance (BDA), Climate Development Advance (CDA), Infrastructure Development Advance (IDA), or Tribal Development Advance (TDA). Please contact the Member Service Desk for information and/or visit our ZDA information page.
Price Incentives for Advances Executed Before Noon: In effect as of Tuesday, September 5, 2023, the FHLBNY is pleased to now offer price incentives for advances executed before Noon each business day. These pricing incentives offer an opportunity to provide economic value to our members, while improving cash and liquidity management for the FHLBNY. For further details, kindly refer to the Bulletin.
The Symmetrical Prepayment Advance Feature
For those anticipating term funding needs, and with rates on an uptrend, it can be an appropriate juncture to consider our SPA feature. This feature allows the member to capture, at prepayment, changes in the fair value of the advance which are favorable to the member. Contact Member Services Desk to discuss.
Looking for more information on the above topics? We’d love to speak with you!
Questions?
If you wish to receive the MSD Weekly Market Update in .pdf format (includes FHLBNY rate charts) or to discuss this content further, please email the MSD Team.