Member Services Desk
Weekly Market Update
Economist Views
Click to expand the below image.
S&P CoreLogic Case-Shiller (SPCLCS) 20-City Home Price Index: Home prices probably remained on an uptrend in the twenty metropolitan areas included in the SPCLCS canvass. Indeed, the 1.2% increase anticipated by the Street in January, if realized, would place home selling prices a hefty 11.0% above the level prevailing at the beginning of 2020.
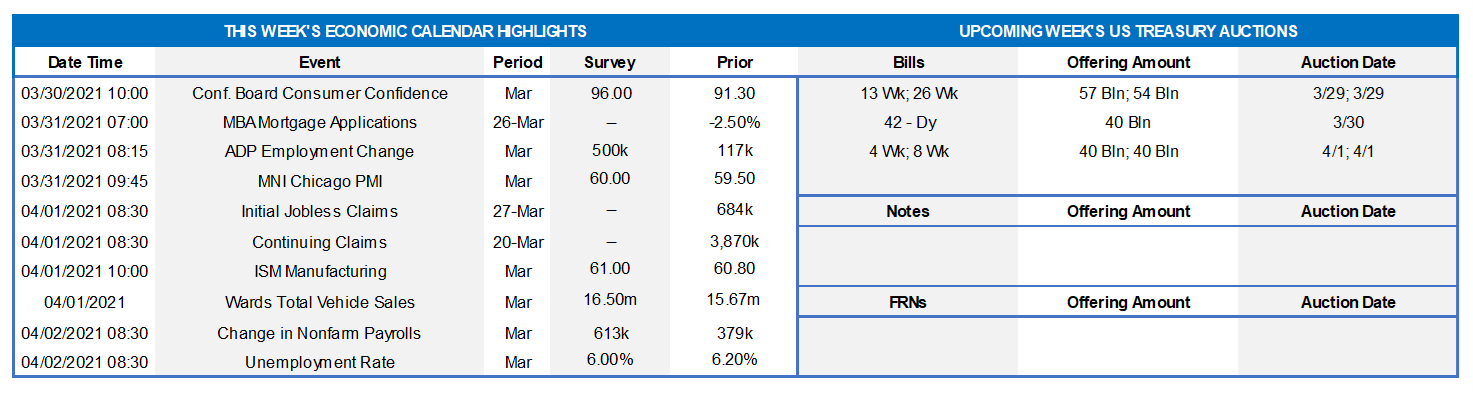
Conference Board Consumer Confidence: Buoyed by the American Rescue Plan and vaccine-related hopes for a return to something that approaches normalcy by the summer, the Conference Board’s sentiment gauge likely climbed from 91.3 in February to a five-month high of 99.5 in March.
ADP National Employment Report: ADP Employer Service’s update on private sector hiring in March may color expectations going into the official government report on Friday. Sharp reductions in both initial and continuing jobless claims since the February canvassing period point to a solid 500K jump in private payrolls, after a comparatively modest 117K rise in the prior month.
Pending Home Sales: Hampered by inclement weather conditions across much of the country in February, contracts to purchase a dwelling are expected to have contracted by 2.6%, after a 2.8% prior-month decline. Despite the pullback anticipated by the consensus, pending home sales would remain 71% above last April’s pandemic low.
ISM Manufacturing Purchasing Managers Index: The nationwide manufacturing expansion marked its tenth month in March, with the pace of activity likely quickening from February’s reported clip. Indeed, solid improvements in a variety of Fed district bank surveys, combined with the preliminary report from Markit Economics, suggest that the ISM factory activity barometer climbed to 63.7% – a level last touched in the fall of 1983.
Employment Situation Report: The BLS’ update for March will be the marquee statistical event of the week. Payroll employment growth is expected to have accelerated sharply, with the consensus projecting a hefty 625K net new positions to be added after February’s 379K gain. The steady decline in the state insured unemployment rate between the February and March canvass periods hints that the civilian jobless rate may have moved below the 6% mark for the first time since the closure of the economy 12 months earlier. With the bulk of hiring likely to be concentrated once again in lower-paid, service-producing segments, average hourly earnings probably edged 0.2% higher, matching the prior-month rise.
Federal Reserve Appearances:
Mar. 29: Fed Governor Waller to take part in virtual discussion on Federal Reserve independence.
Mar. 30: Fed Vice Chair for Supervision Quarles to take part in a virtual discussion on financial stability.
Mar. 30: New York Fed President Williams to take part in a moderated discussion on the role of small businesses.
Apr. 1: Philadelphia Fed President Harker to speak at a virtual fintech symposium.
Click to expand the below images.
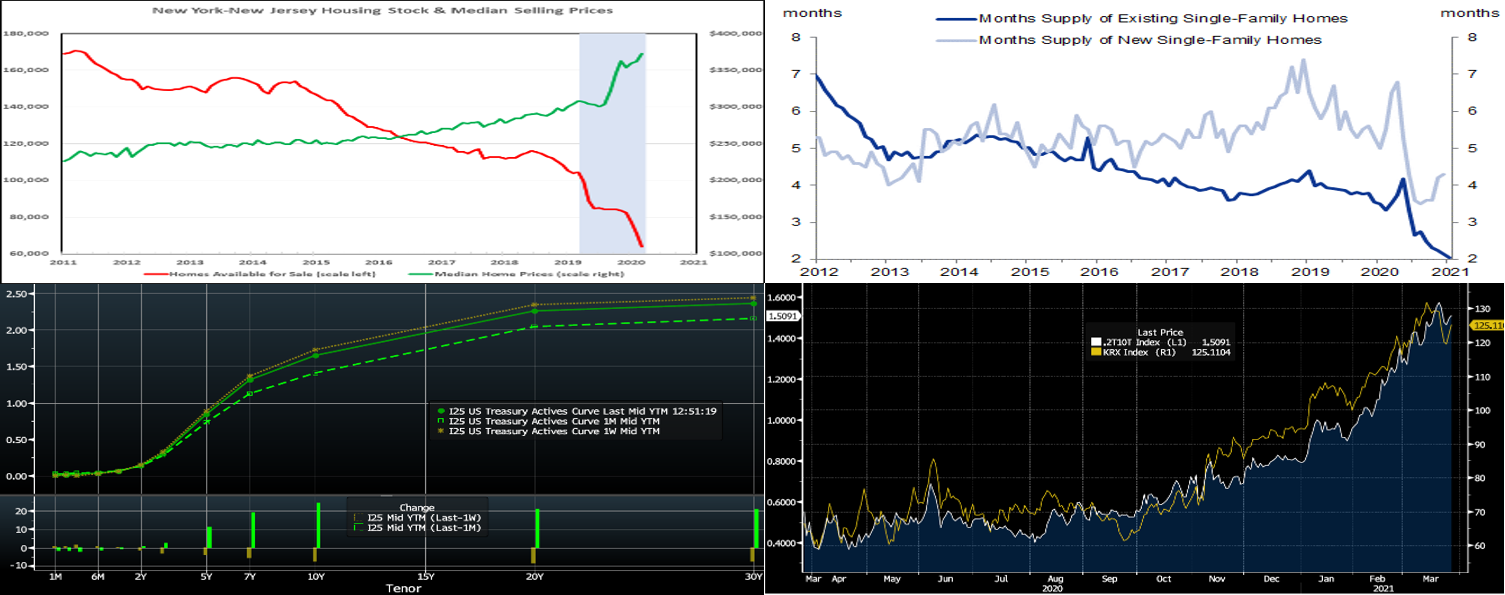
CHART 1 – UPPER LEFT
Source: FHLBNY, NJ Realtors and NYS Association of Realtors. Note: Shaded area denotes recession. The residential real estate market across the Empire and Garden States remained firm in February. Closings climbed by an estimated 2.1% to almost 25.8K after seasonal adjustment, with sellers receiving all but a fraction of their posted asking prices. While higher mortgage interest rates will undoubtedly test demand heading into the traditional spring buying season, a supply-induced jump in median selling prices could prove an even higher hurdle. Indeed, the stock of available homes in NYS and NJ has fallen by a staggering 39% to a record low level over the 12 months ended February, with the estimated median selling price across the two states soaring by roughly 21% to $372,910.
CHART 2 – UPPER RIGHT
Source: National Association Realtors (NAR), Census Bureau, Haver Analytics, Goldman Sachs Research. Further on the housing backdrop but on a national level, the supply of homes for sale has markedly declined in the past year, a dynamic that has helped push prices higher. Months’ supply of existing single-family homes is almost literally at an “off the chart” low of 2. This condition, in combination with high prices and recently higher mortgage rates, may temper near-term sales activity until or unless conditions adjust a bit.
CHART 3 – LOWER LEFT
Source: Bloomberg. Note: top pane is yield (%), bottom pane is change (bps). The UST curve this week retraced some of its recent “bear steepening”. While shorter maturities finished a bp or two lower, the 5 through 10-year sector was ~2 to 7 bps lower, in progressive fashion. Essentially, yields reached levels that proved attractive for some investor bases, such as foreign investors, to add duration. Moreover, Fed officials “made the rounds” (interviews/speeches/Congressional testimony) with their consistent theme of “on hold” while emphasizing that the Fed will not act pre-emptively to “get ahead of” or stem near-term inflation signs. Meanwhile, the Covid-19 situation sits at elevated plateaus, but the notable upward trend in vaccinations has boosted economic optimism and projections. Relief/stimulus checks are reaching the public and talk of an infrastructure bill continues, thereby further provoking near-term upward adjustments to forecasts of both economic data and UST supply. Given these dynamics, an aggressive further retracement of the recent “bear steepening” would appear difficult.
CHART 4 – LOWER RIGHT
Source: Bloomberg. Portrayed here is the UST 2-year/10-year curve (LHS, %) vs. the KBW Regional Bank Stock Index (RHS). The continued upward/steeper move in rates should prove welcome for many financial institutions’ net interest figures, and, indeed, the market has priced bank stocks higher in virtual lockstep with the yield curve in recent months. As noted in recent editions, the recent “bear steepening” of the curve helps to make longer assets a more attractive outlet to “put funds to work”. Until stronger loan growth resumes, and now with more attractive net interest income potential, MBS purchases by banks are likely to increase further from the impressive pace thus far this year.
FHLBNY Advance Rates Observations
Front-End Rates
Short-end advance rates finished a bp higher up to 2-month but unchanged thereafter, week-over-week. Government-Only Money Market Funds’ AUM increased by a hefty $15.3bn this past week; this sector has infused demand for short paper in the past two months. Meanwhile, the GSEs have been placing larger sums into money markets, and this trend is typically magnified leading up to MBS coupon payments on the 25th of the month. From a bigger-picture vantage point, an overall moderation in the market supply of short paper, in tandem with high cash levels in the market, is expected to keep short-end rates relatively steady and under downward pressure in the year’s first half.
UST issuance overall is now net positive supply in that more is being issued than what the Fed is buying in its programs. However, with short UST rates at rock-bottom levels and the Fed on hold for a long period, rates are likely to persist in a near-term sideways to softer pattern. Importantly, weekly net T-bill issuance has been lower since last summer and even negative at times in recent weeks/months, and Treasury has announced plans to shift issuance out the curve. The new relief package and related borrowing likely will lead to an increase of T-bill auction sizes and positive net supply, but overall market supply/demand dynamics should keep short rates in check on the upside.
Term Rates
On the week, medium and longer-term Advance rates were a bp or two lower in shorter tenors but ~2 to 6 bps lower 5-year and out, in progressive fashion. Kindly refer to the previous section for further color on relevant market dynamics.
The upcoming week brings heavy and record-high UST term supply in the form of the Treasury’s quarterly refunding of 3/10/30-year notes. This supply is likely the reason for the curve to modestly steepen towards the end of the week. Treasury also announced its plans to lengthen the maturity profile of its issuance via more longer–term issuance and less T-bills. Attention will remain on further relief legislation and certainly also on COVID-19 and the question of whether or not it is being managed effectively enough to avoid further pauses in reopening. A key data highlight will be the jobless claims release and its trends.
New Product Alert: In order to satisfy member needs and provide greater product flexibility to match bond and derivative market conventions, FHLB-NY now offers SOFR-linked advances based on SOFR-index compounding. Note that this product is in addition to SOFR-linked advances based on SOFR-index averaging which have been offered since November 2018.
The Symmetrical Prepayment Advance Feature
With rates at or near multi-year lows, it is a compelling juncture to use the SPA feature on term advances. This feature allows member to capture, at prepayment, changes in the Fair Value of the advance which are favorable to the member. Contact us to discuss.
Looking for more information on the above topics? We’d love to speak with you!
Questions?
If you wish to receive the MSD Weekly Market Update in .pdf format (includes FHLBNY rate charts) or to discuss this content further, please email the
MSD Team.
Special Member Alert
The FHLBNY recently announced a newly expanded and flexible Disaster Relief Funding (DRF) advance program which offers discounted rate advances with maturities 1-mo and greater. Additionally, we have announced that PPP loans will be accepted as eligible collateral. Please contact us with any questions.