Member Services Desk
Weekly Market Update
This MSD Weekly Market Update reflects information for the week of May 16, 2022.
Economist Views
Click to expand the below image.
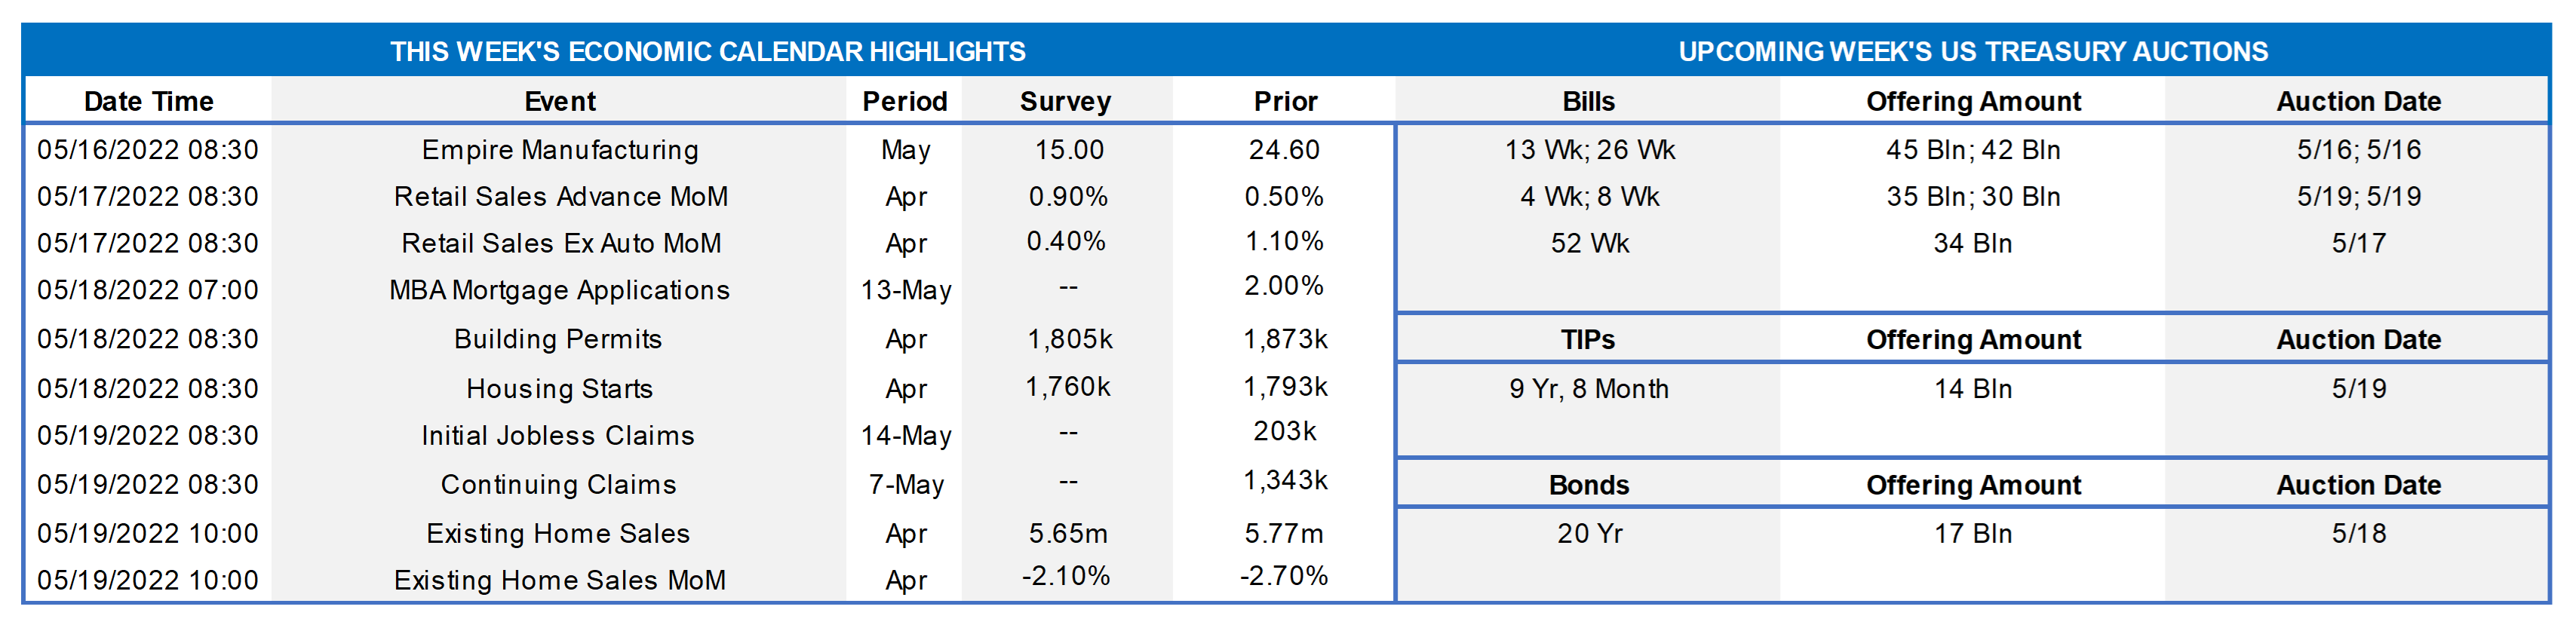
Real GDP growth is expected to rebound during the current quarter, expanding at an annual rate of roughly 3% after the surprising 1.4% contraction witnessed during the winter. This week’s reports on retail sales, industrial production, residential building activity and existing home purchases will allow economists to mark-to-market their Q2 tracking estimates. Federal Reserve officials are scheduled to make half a dozen appearances on a variety of timely topics. Appearances by the presidents of the Cleveland, New York, and St. Louis district banks – all FOMC voting members – will be watched closely for their thoughts on prospective changes in monetary policy.
Empire State Manufacturing Survey: The manufacturing expansion in New York State probably continued in May, although the pace of growth likely slowed from April’s reported clip. The net percentage of survey respondents experiencing a pickup in general business conditions is expected to retreat to 15% from 24.6% in the previous month.
Retail & Food Services Sales: Powered by an anticipated rebound in motor vehicle purchases, retail and food services sales probably climbed by 1% in April, following a .7% increase in March. Net of a projected 3.5% jump in auto-dealership revenues, retail sales are expected to have edged .4% higher during the reference period, after a solid 1.4% prior-month gain. As always, market participants will pay particular attention to so-called control sales excluding auto, building materials and gasoline purchases. Barring any prior-month revisions, the .8% rise anticipated by the Street would leave core purchases in April 5.7% annualized above their January-March average, following an 8.9% Q1 gain.
Industrial Production & Capacity Utilization: Production at factories, mines and utilities is expected to have risen by .4% in April, after a .9% gain in March. With output likely eclipsing additions to productive capacity during the reference period, the overall operating rate likely rose by .3 percentage point to 78.6% – the highest level since the beginning of 2019.
NAHB/Wells Fargo Housing Market Index (HMI): Homebuilders’ appraisals of current and prospective sales likely eroded slightly in May in response to the ongoing backup in mortgage interest rates. The Street expects the HMI to move two points lower to 75 yet remain well above the 50-point mark associated with neutral market conditions.
Housing Starts & Building Permits: Capped by a return to more normal weather conditions, the number of new housing units started and building permits issued probably retreated from the respective seasonally adjusted annual rates (SAAR) of 1.79mn and 1.87mn recorded in March.
Existing Home Sales: The decline in purchase signings witnessed over the February-March span suggests that closings retreated by 2.1% to a SAAR of 5.65mn in April – the lowest level since the 4.84mn homes sold in June 2020. With normal seasonal patterns pointing to a 9.5% jump in the number of homes on the market to 1.04mn, the stock of unsold will dwellings likely is at 2.2 months’ supply.
Federal Reserve Appearances:
- May 16 New York Fed President Williams to take part in a discussion hosted by the Mortgage Bankers Association in New York.
- May 17 St. Louis Fed President Bullard to discuss the outlook at a conference hosted by the Energy Infrastructure Council.
- May 17 Philadelphia Fed President Harker to discuss healthcare as an economic driver.
- May 17 Cleveland Fed President Mester to give opening remarks at a virtual panel discussion hosted by her bank.
- May 17 Chicago Fed President Evans to discuss the outlook with the Money Marketeers of New York University.
- May 18 Philadelphia Fed President Harker to discuss the outlook with the Mid-Size Bank Coalition of America.
Click to expand the below image.
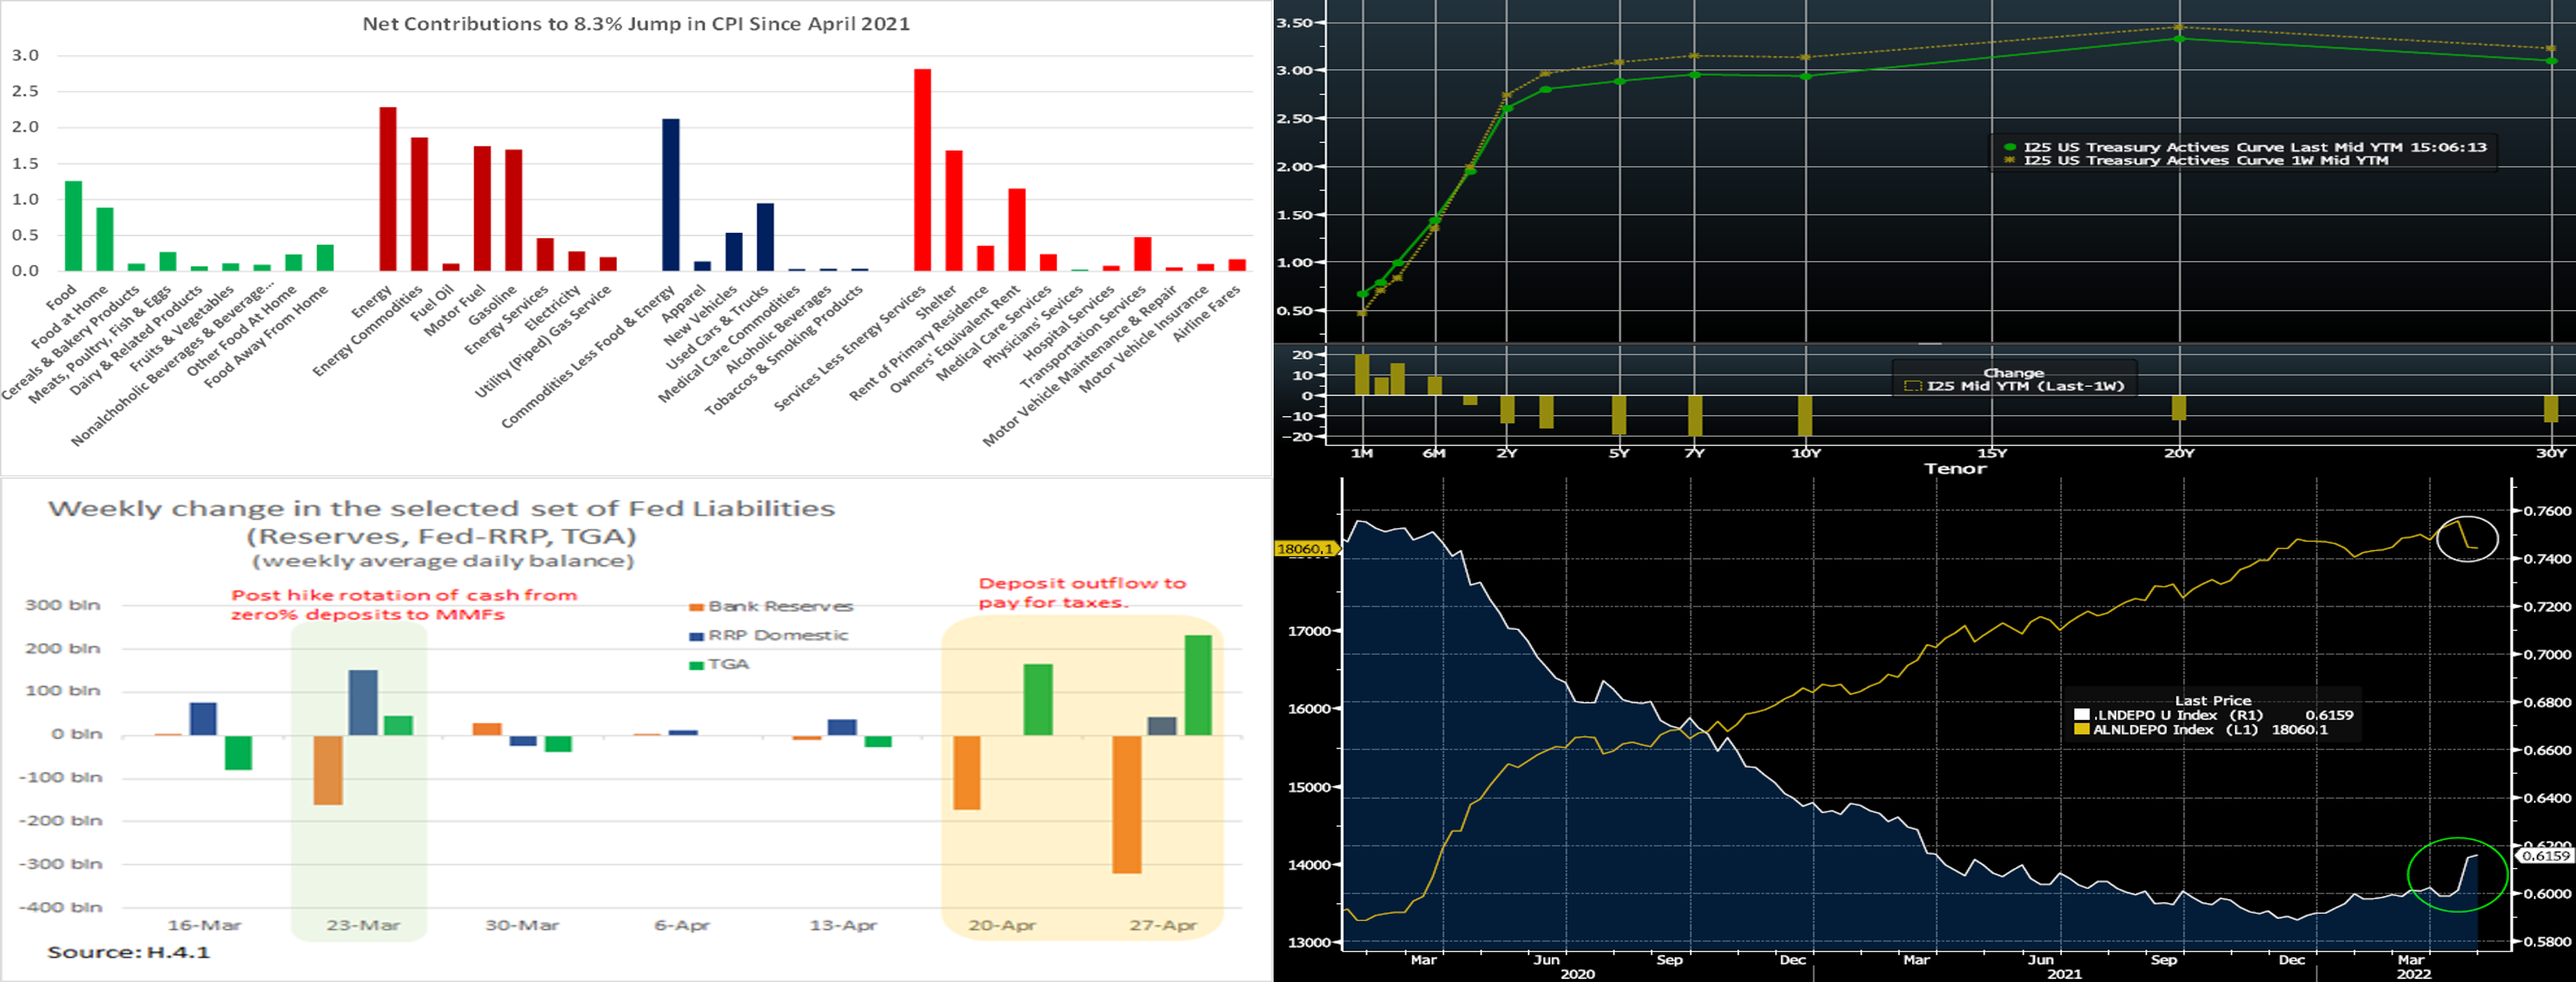
CHART 1 UPPER LEFT
Source: BLS, FHLBNY. Prices have risen by a hefty 8.3% over the latest 12 months. While increases have been widespread across retail goods and services categories, three areas stand out. Exacerbated by the Ukraine crisis, energy prices have leapt by just over 30% since April 2021, accounting for almost one-third of the increase in the headline CPI. Hikes in auto prices attributable to the ongoing shortage of chips and higher shelter costs have each contributed another 1.5 percentage points. While a large rise, CPI slowed from the month prior, as it edged .3% higher in April, following a 1.2% leap in March. And the increase pared the Y-o-Y rise in the headline rate to 8.3% from the four-decade high of 8.5% posted in March. Key consumer inflation metrics likely will remain well above the Fed’s desired 2% target for an extended period. The Fed believes that with appropriate firming in the stance of monetary policy, inflation will return to the desired objective, and the labor market will remain strong.
CHART 2 UPPER RIGHT
Source: Bloomberg. Note: Top pane is yield (%), bottom pane is change (bps). The curve notably flattened week-over-week, with the short-term sector yields higher but longer-term yields lower. The bulk of the upward move in the money market sector occurred on Friday. Yields 2-year and longer were lower by varying degrees. The 5 to 10-year zone was ~20 bps lower. After the runup in yields of recent months, the market experienced some short-covering from trading-oriented investor types. Also, longer yields declined partly owing to the market’s potentially budding view that the tightening of financial conditions may now serve to quell the pace of inflationary forces. Indeed, the 5-year “Breakeven” inflation rate on TIPS fell by ~18 bps from the week prior. Yields also benefited from flight-to-quality demand, as stocks continued to stagger and were ~2.4% lower on the week as of Friday afternoon. Yields had been lower on Thursday but tracked higher on Friday when stock markets recovered from previous dismal sessions. The market remains highly volatile, and we continue to encourage members to monitor rates and engage with the desk for information and color.
CHART 3 LOWER LEFT
Source: FRB; FHLBNY. Portrayed here are recent flows in the cash and banking system. After the Fed lifted the policy rate off the 0% lower bound at the March FOMC meeting, cash rotated out of low or non-interest bank deposits into other vehicles. Deposits declined, as evidenced by the decline in bank reserves (orange bar). In turn, money market funds (“MMFs”) experienced inflows, as evidenced by the notable rise in the Fed’s RRP balance, a currently popular vehicle for MMF assets. This dynamic recurred following the May 4 FOMC policy rate hike. The short-end yield curve is now high enough for MMFs to be a more compelling vehicle net-of-fees, and so more of this cash rotation dynamic can be anticipated. Meanwhile, also seen here is the large increase in the TGA (Treasury General Account, green bar) in April. This dynamic largely resulted from a surge of higher-than-expected (~$491bn) personal tax payments. In turn, deposits experienced a decline, as reflected in the drop in bank reserves.
CHART 4 LOWER RIGHT
Source: Bloomberg. Following on the above topic from a “bigger-picture” perspective, shown here is the trend of bank deposits (LHS, gold, ~$18.06trn) and the banking industry loan-to-deposit ratio (RHS, white). The former has experienced a recent decline, while the latter has risen from previous very low levels. After a period of muted loan growth, banks have been reporting a pickup in demand and the industry-wide loan growth outlook remains robust at present. Meanwhile, deposit growth appears to have begun a reversal, as the Fed’s Quantitative Easing program is now complete and fiscal relief programs have largely run their course. Indeed, deposits should significantly contract during the soon-to-begin Quantitative Tightening cycle that will inherently drain liquidity from the banking system. The FHLB-NY is here to help members quickly and efficiently manage these dynamics.
FHLBNY Advance Rates Observations
Front-End Rates
- Short-end Advance rates finished higher week-over-week, with more sizable moves occurring in the shortest maturities partly owing to weakness in the T-bill market. Meanwhile, the market’s ongoing aggressive pricing of forthcoming Fed rate hikes have served to trend advance rates higher. As of this past Friday afternoon, the market priced for a 100% probability of a 50 bps and ~15% chance of a 75bps hike at the June 15th FOMC meeting. The July meeting is priced for a 50bps hike thereafter. This pricing and the fact that maturities are crossing further into the timeline of the Fed hiking cycle, were causal factors in the rate moves.
- Given the Fed tightening posture and upcoming FOMC meetings, rates will remain highly responsive to the market’s moves and pricing of the Fed.
Term Rates
- Longer term rates were notably lower, week-over-week, and mirrored moves in the UST market. Kindly refer to the previous section for relevant market color.
- On the UST term supply front, this upcoming week brings a 10-year TIPS and a 20-year nominal auction. Given ongoing market volatility, members should monitor conditions for potentially more optimal timing on transactions. Please call the desk for information on market dynamics, rate levels, or products.
Product Alert: FHLBNY is pleased to announce enhancements to our Advance Rebate Program, which provides members an opportunity to receive a cash rebate when prepaying an eligible advance and rebooking a new advance within a 30-day period. Rebate-eligible advances now must have a minimum of 6-months (reduced from 1-year) remaining. Moreover, the potential cash rebate has been increased. This program can be suitable for those wishing to extend their liability duration and/or potentially improve net interest margin. Please call the Member Service Desk at (212) 441-6600 for more information.
Forward Start Advance (FSA): For members with upcoming borrowing or refunding plans, consider the FSA as a method to opportunistically “lock in” rates before advance settlement date. Please call the Member Service Desk at (212) 441-6600 for more information.
The Symmetrical Prepayment Advance Feature
With rates at or near multi-year lows, it is a compelling juncture to use the SPA feature on term advances. This feature allows member to capture, at prepayment, changes in the Fair Value of the advance which are favorable to the member. Contact us to discuss.
Looking for more information on the above topics? We’d love to speak with you!
Questions?
If you wish to receive the MSD Weekly Market Update in .pdf format (includes FHLBNY rate charts) or to discuss this content further, please email the MSD Team.