Member Services Desk
Weekly Market Update
Economist Views
Click to expand the below image.
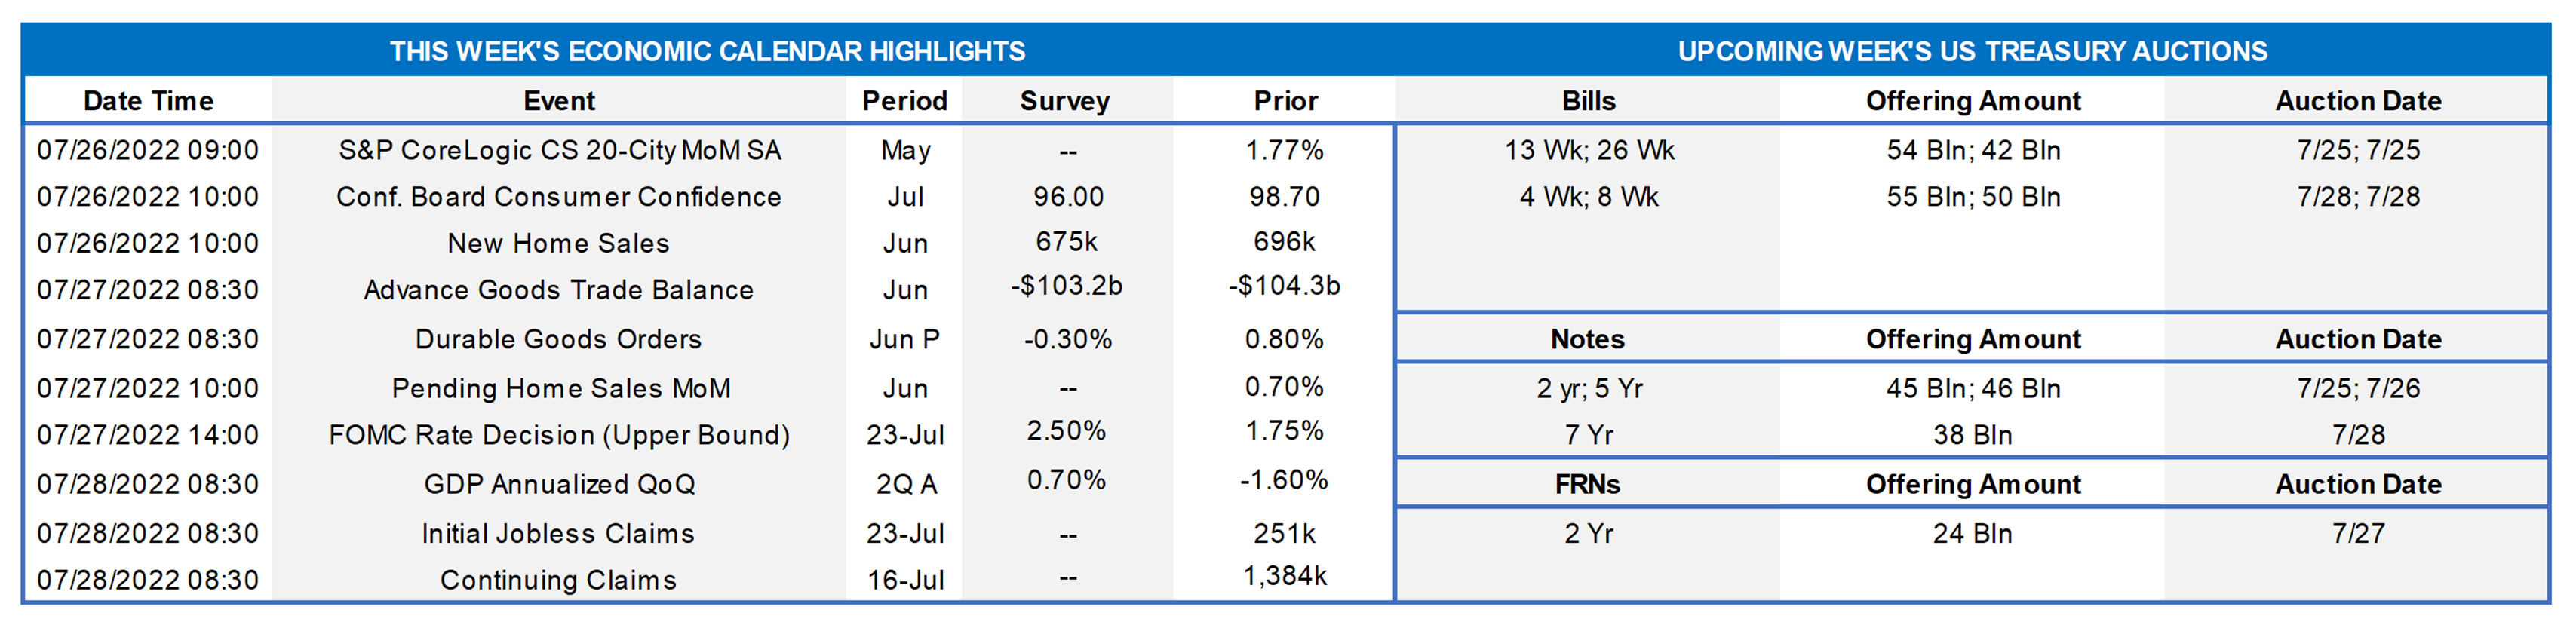
The Federal Open Market Committee (FOMC) meeting will be the marquee event of the week. Despite sizable markdowns to spring-quarter real GDP growth projections and continued uncertainty caused by the conflict in Ukraine, the FOMC is universally expected to raise the federal funds target range by another 75 bps to 2.25% to 2.5% and reiterate that further increases likely will be appropriate in coming months. The post-meeting communiqué likely will contain a less positive appraisal of overall economic activity than that of the mid-June meeting but will repeat that job gains have been robust in recent months and that the unemployment rate has remained low. The policy statement is also expected to point out once again that inflation remains elevated, reflecting supply and demand imbalances related to the pandemic, higher energy prices, and broader price pressures. The FOMC will undoubtedly note that it is highly attentive to inflation risks and may acknowledge the tightening of financial conditions. On the data front, the initial report on real GDP growth during the spring quarter will be the most closely watched. While gauges used by the National Bureau of Economic Research to determine cyclical turning points are consistent with continued expansion, a second consecutive contraction in real GDP in Q2 would undoubtedly raise recession alarms.
S&P CoreLogic Case-Shiller (SPCLCS) 20-City Home Price Index: Home prices probably climbed at a marginally slower pace across the twenty major metropolitan areas canvassed by SPCLCS in May. The 1.6% rise anticipated by the Street, after a 1.8% gain in May, would still place home selling prices a record 21.2% above those recorded 12 months earlier.
Conference Board Consumer Confidence: Surging inflation and rising interest rates probably continued to weigh on consumers’ appraisals of current and prospective economic conditions, leaving the Conference Board’s sentiment gauge at an 18-month low of 91.5 in July.
New Home Sales: Reported pullbacks in permits and starts hint at a decline of 12.4% to a SAAR of 610K in June – the fewest contract signings since the pandemic low of 582K posted in April 2020.
Durable Goods Orders: Pared by an anticipated dip in transportation equipment, durable goods orders likely dipped by .3% in June, erasing almost half of May’s .8% rise. Excluding the projected pullback in transport orders, “hard goods” bookings are expected to have edged .3% higher during the reference period and jumped by 7.4% over the latest 12 months. Nondefense capital goods shipments excluding commercial jet deliveries will be watched closely to gauge the strength of business equipment spending heading into the following morning’s report on Q2 real GDP growth.
Pending Home Sales: Home-contract signings probably moved lower in June, after the surprising .7% uptick recorded in the previous month.
Real GDP Growth: The Bureau of Economic Analysis’ advance look at real GDP growth in Q2 is expected to reveal a modest .8% annualized gain, following the 1.6% winter contraction. The range of projections is unusually wide, however, extending from a 2.1% decline to a 3.5% rise. With inventory liquidations likely capping the headline figure once again, we will closely watch the pace of real final sales to domestic purchasers. In contrast to the disappointing performance of real GDP in Q1, real domestic demand quickened to 2% from 1.7% over the final three months of 2021. While still well above the Fed’s desired 2% target, closely followed inflation gauges probably slowed on a quarter-to-quarter basis.
Jobless Claims: The DOL’s weekly tally of new unemployment insurance claims will be monitored for signs that labor demand is slowing in response to the Fed’s aggressive tightening of monetary policy. The increase to 241K over the course of the July establishment survey period, from 222K in the prior month, suggests that nonfarm payroll growth slowed from the 372K workers added in June.
Federal Reserve Appearances:
- July 27 Federal Open Market Committee monetary policy statement to be released.
- July 27 Federal Reserve Chair Jerome Powell to hold post-FOMC-meeting press conference.
Click to expand the below image.
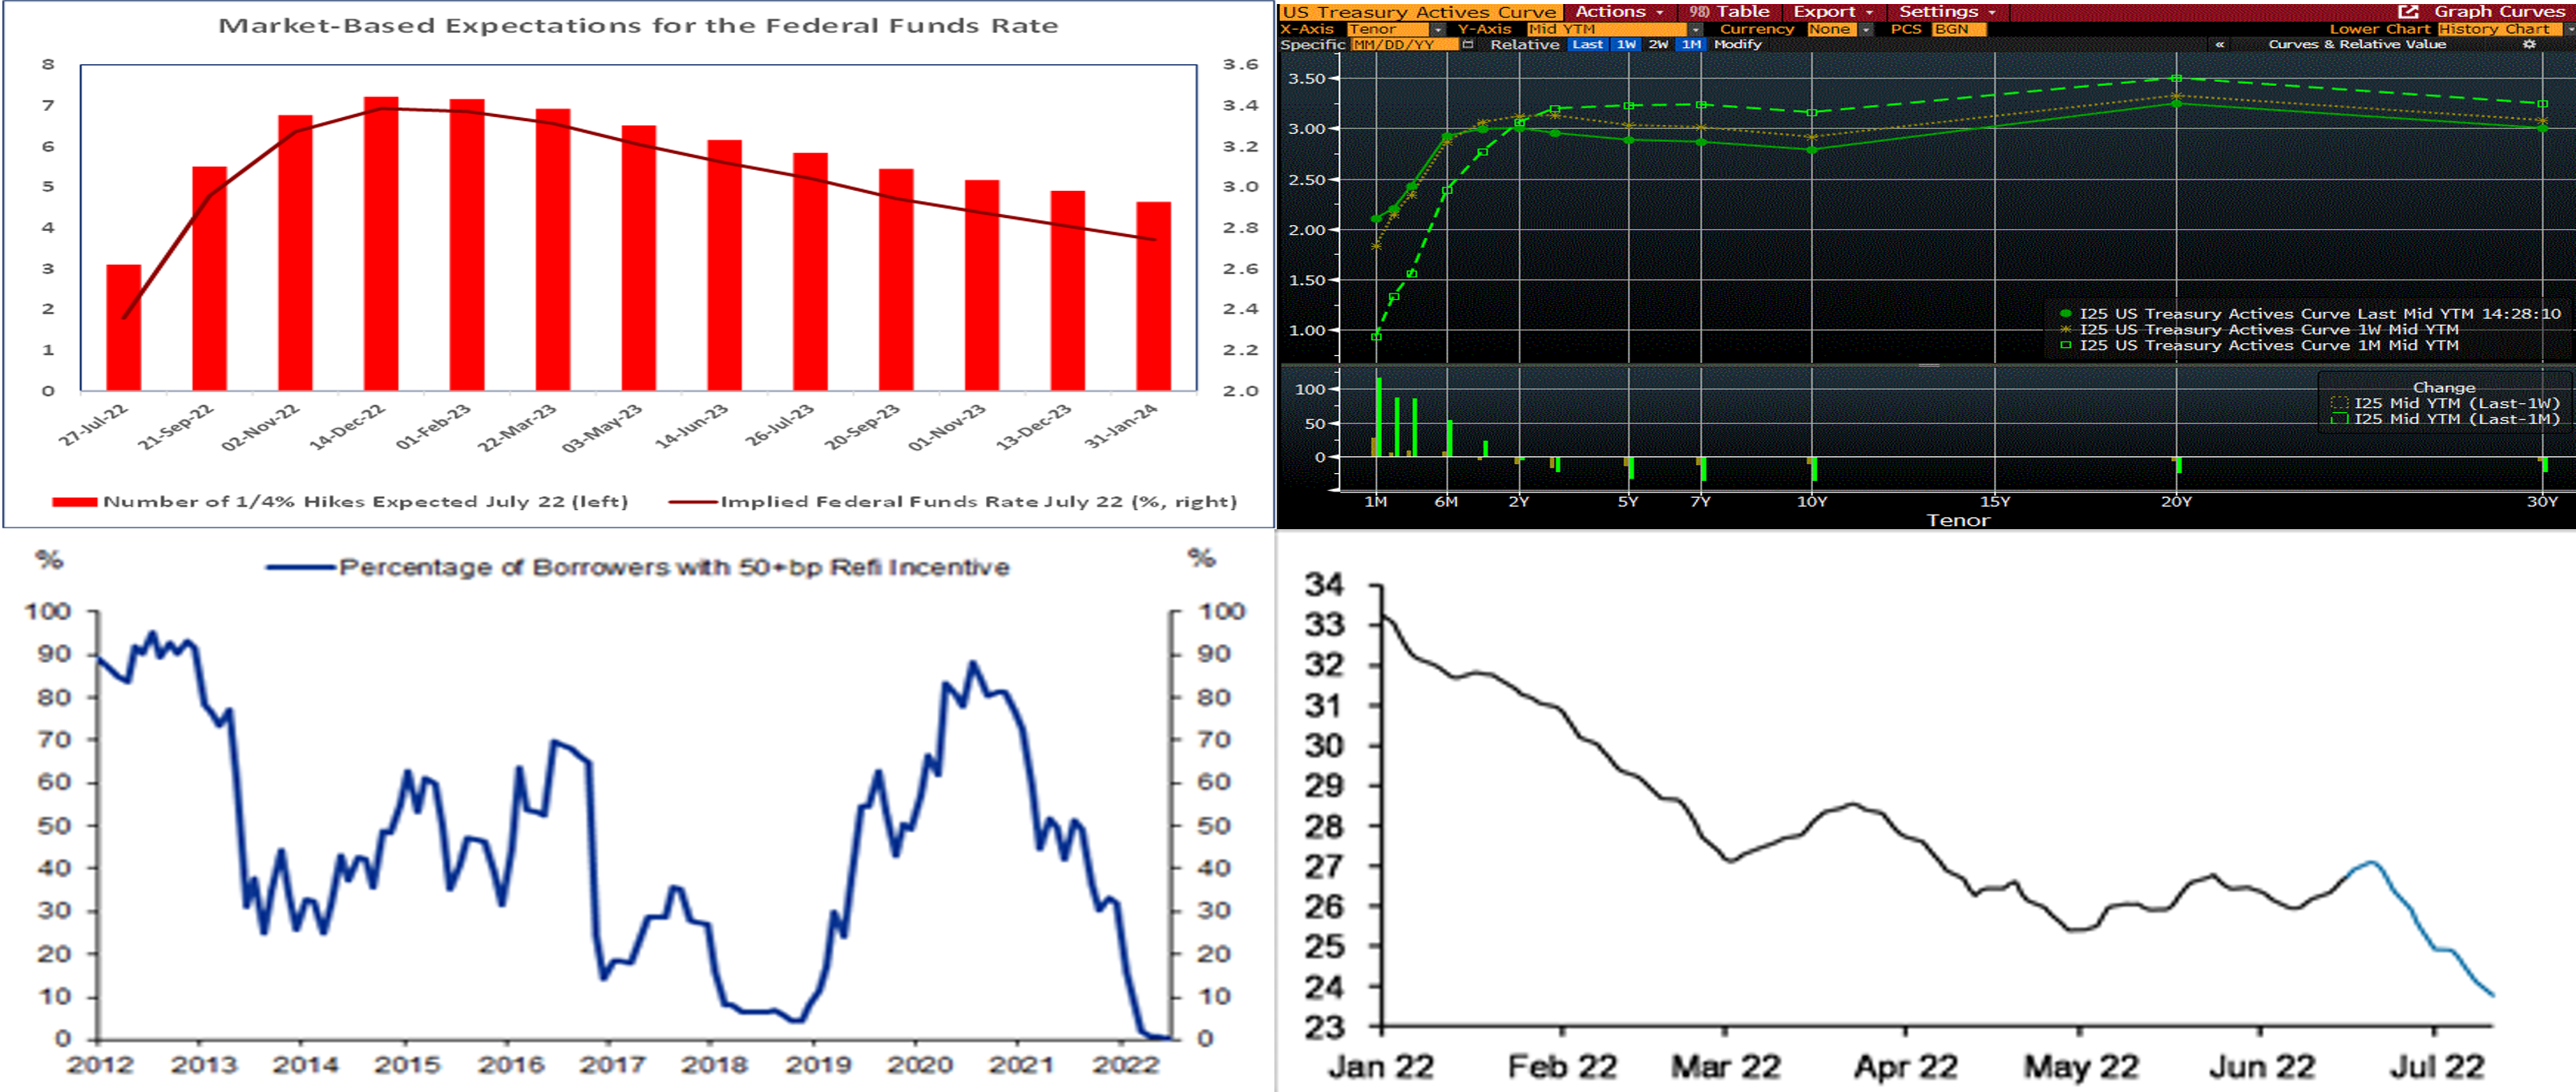
CHART 1 UPPER LEFT
Source: Bloomberg; FHLB-NY. Traders and investors now price in with full certainty a 75-bps hike in the federal funds rate target range at this week’s FOMC meeting, with the chance of a more aggressive 100-bps hike placed at just 10%. In contrast to Fed officials’ call for additional rate hikes in 2023 contained in the latest dot plot issued following the mid-June gathering, market participants expect the current tightening cycle to end by December, implying a view that the central bankers will either be successful in curbing inflation or more likely will have pushed the economy into recession by that time.
CHART 2 UPPER RIGHT
Source: Bloomberg. Note: Top pane is yield (%), bottom pane is change (bps). The yield curve finished the past week notably flatter from both a week and a month ago. Very-short maturities continue to rise, as they cross further past and into the Fed hiking cycle timeline. All tenors 2-year and out were lower week-over-week.
CHART 3 LOWER LEFT
Source: Bloomberg. eMBS, Goldman Sachs Research. Shown here is the percentage of outstanding 30-year conventional mortgages that are at least 50 bps “in-the-money” for refinancing. After the yield curve rise of this year, it is now in single digits. In a sense, much of the mortgage universe has fully extended, and its negative convexity has markedly declined. For those now adding large fresh production to their portfolios, a funding/hedging product to consider is our callable advance, as it provides protection to rates rising further but also provides the option to call/cancel the funding if/when the rate cycle turns and declines.
CHART 4 LOWER RIGHT
Source: Crane Data; JP Morgan. As covered in last week’s edition, money market funds (“MMFs”) continue to deploy large sums to the Fed’s RRP, especially since the RRP, at 1.55% rate, has been yielding more than very short-term T-bills. This trend has persisted and increased this month, as MMFs have sought to significantly decrease their WAMs (weighted average maturities) ahead of the uncertainty of potentially larger-than-expected Fed hikes. This trend is clear in this chart of the 5-day Moving Average (LHS, days) of government MMF WAMs. The WAM has decreased since early in the year and has notably decreased since the June FOMC. These dynamics in the front-end of the curve have served to spur moves in the short-end market and advance rates. We highly encourage our readers to engage with us to monitor day-to-day and intraday moves.
FHLBNY Advance Rates Observations
Front-End Rates
- Short-end Advance rates finished rather flat week-on-week. Short-end markets remain volatile, thereby leading to some dynamic moves in rates both day-to-day and intraday. While there are large amounts of cash chasing limited supply in the front-end, the pricing of Fed hikes continues to pressure yields higher. As of this past Friday midday, the market priced for a 100% chance of another 75 bps, and 15% chance of a 100 bps for the July 27th FOMC. And then a 50 bps, with 45% chance of another 75 bps, hike is priced for the Sept. 21st FOMC. This pricing, and the fact that maturities are crossing further into the timeline of the Fed hiking cycle, contributed to the rate moves.
- Given the Fed tightening posture and upcoming FOMC meetings, rates will remain highly responsive to the market’s moves and pricing of the Fed.
Term Rates
- The longer-term curve finished notably flatter week-over-week, generally mirroring the move in UST and swaps markets. While the 1 and 2-year were 9 & 15 bps lower, respectively, 5-year finished 18 and 10-year 14 bps lower from the week prior. Kindly refer to the previous section for further color on relevant market dynamics. The curve is extremely flat and even inverted at various points, thereby offering opportunities to extend in advance duration for minimal, if any (and, at some points, potentially less), coupon cost.
- On the UST term supply front, this upcoming week contains 2/5/7-year auctions. The focus will clearly land on the FOMC. Please call the desk for information on market dynamics, rate levels, or products.
Product Alert: FHLBNY is pleased to announce enhancements to our Advance Rebate Program, which provides members an opportunity to receive a cash rebate when prepaying an eligible advance and rebooking a new advance within a 30-day period. Rebate-eligible advances now must have a minimum of 6-months (reduced from 1-year) remaining. Moreover, the potential cash rebate has been increased. This program can be suitable for those wishing to extend their liability duration and/or potentially improve net interest margin. Please call the Member Service Desk at (212) 441-6600 for more information.
Forward Start Advance (FSA): For members with upcoming borrowing or refunding plans, consider the FSA as a method to opportunistically “lock in” rates before advance settlement date. Please call the Member Service Desk at (212) 441-6600 for more information.
The Symmetrical Prepayment Advance Feature
With rates at or near multi-year lows, it is a compelling juncture to use the SPA feature on term advances. This feature allows member to capture, at prepayment, changes in the Fair Value of the advance which are favorable to the member. Contact us to discuss.
Looking for more information on the above topics? We’d love to speak with you!
Questions?
If you wish to receive the MSD Weekly Market Update in .pdf format (includes FHLBNY rate charts) or to discuss this content further, please email the MSD Team.