Member Services Desk
Weekly Market Update
This MSD Weekly Market Update reflects information for the week of December 13, 2021.
Economist Views
Click to expand the below image.
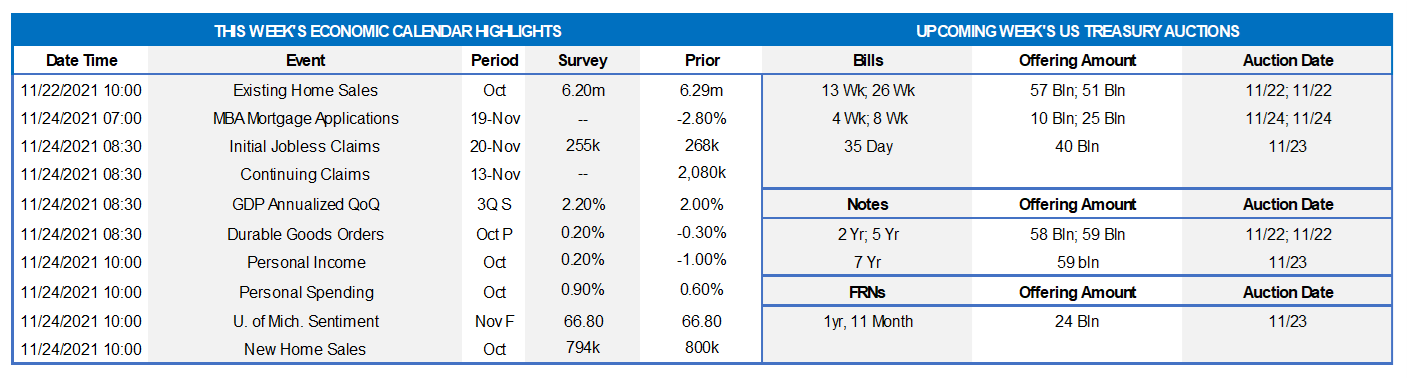
The Federal Open Market Committee (FOMC) meeting will highlight the week. The FOMC is expected to leave the federal funds rate target range unaltered at 0 to ¼% but announce a faster pullback from the asset-purchase program that would presumably set the stage for increases in administered rates by the middle of 2022. Responding to this year’s flare-up in inflation and recent reacceleration in economic activity, Fed officials have spoken increasingly about the need to taper purchases of USTs and agency MBS sooner than previously planned. It now appears likely that the Fed will double reductions in net purchases of USTs to $20bn/month and pare those of MBS by $10bn/month in the middle of January. This quicker taper pace would end the Federal Reserve’s net securities-purchase program three months earlier in March. Beyond that point, as was the case in 2014, the Fed will likely continue to reinvest principal payments from its holdings of MBS and roll over maturing USTs at auctions.
NFIB Small Business Optimism Index: Already reported labor-market soundings for November suggest that the National Federation of Small Business’ sentiment gauge was little changed from the 98.2 reading posted in October.
Producer Price Index: Prices likely moved higher last month, with the headline gauge climbing by .5% after a .6% increase in October. Excluding volatile food, energy and trade costs, the core PPI probably continued apace, rising by .4% for a second straight month. These projections, if realized, would place the overall and core PPIs 9.1% and 6.6% above their respective year-ago levels.
Empire State Manufacturing Survey: Manufacturers in NYS are expected to report that general business activity expanded for an 18th straight month in December, with the anticipated pace of activity slowing from that of November. The general business conditions diffusion index – the percentage of respondents experiencing a pickup in activity less than those witnessing a decline – likely retreated to 25.5% from 30.9% in the previous month.
Retail and Food Services Sales: To be released on the 15th, the Census Bureau’s update on retail activity in November will allow economists to update their forecasts for consumer spending growth in the current quarter. Stepped-up purchases across a wide variety of business segments are expected to boost the headline tally by .7%, following a stronger-than-expected 1.7% jump in October. As always, market participants will be paying particular attention to so-called control sales excluding auto, building materials and gasoline purchases. Barring any prior-month revisions, an on-consensus .8% gain would leave core purchases over the past two months a healthy 13.5% annualized above their July-September average, after a comparatively modest 3.4% Q3 gain.
NAHB Housing Market Index: Likely to finish 2021 on a high note, this barometer is expected to edge one point higher to 84 and thereby end the year well above the neutral 50-point mark.
Jobless Claims: Initial and continuing claims under regular state unemployment insurance programs probably moved lower over their latest respective reporting periods. The end of pandemic-related benefits suggest that the total number of persons receiving assistance will also decline from the 1.95mn, or 1.2% of the civilian labor force, recorded in the prior week.
Housing Starts & Building Permits: The number of new units started likely climbed by 3.1% to a 3-month high SAAR of 1.57mn in November, erasing the .7% decline posted in October. The number of new building permits issued – a good indicator of prospective residential construction activity – probably edged 1% higher to 1.67mn, building on the 4.2% prior-month rise.
Industrial Production & Capacity Utilization: To be released on the 16th, production is expected to have risen by .7% last month, following the solid 1.6% gain recorded in October. With output likely eclipsing additions to productive capacity during the reference period, the overall operating rate probably climbed by a .4 percentage point to 76.8% — the highest level since November 2019.
Federal Reserve Appearances: Federal Reserve Chair Jerome Powell will hold a press conference following the December 14-15 FOMC meeting.
Click to expand the below image.
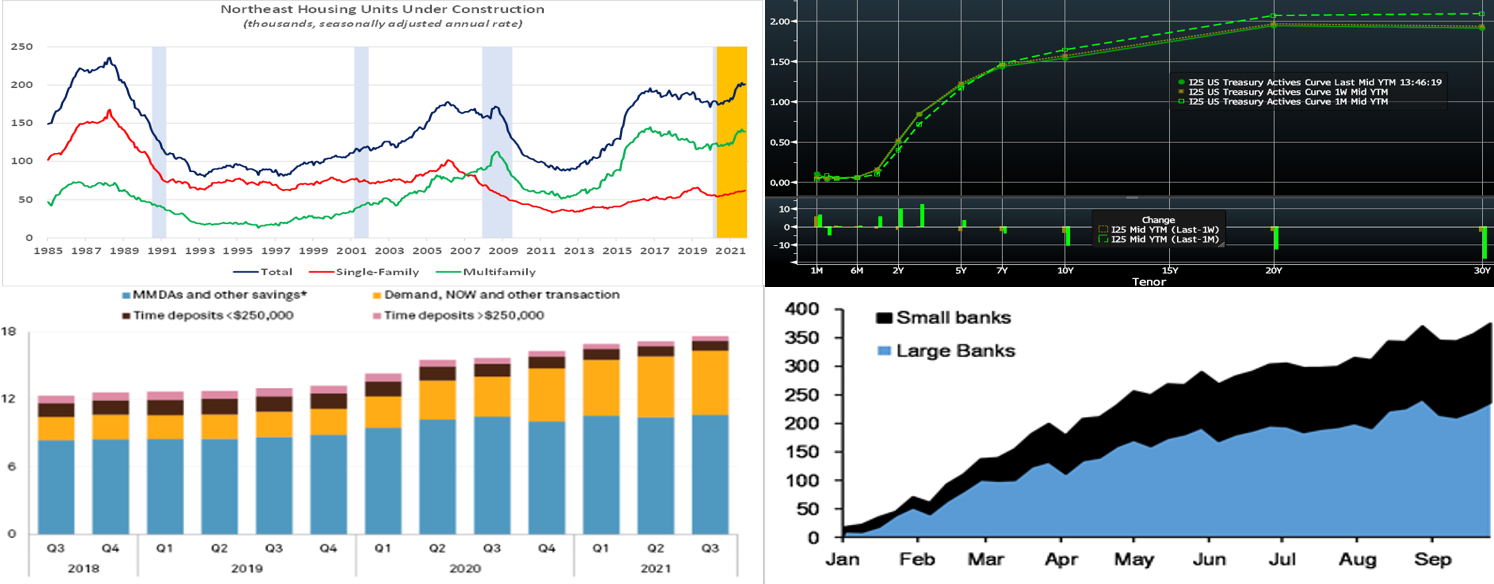
CHART 1 UPPER LEFT
Source: Federal Reserve Board; FHLBNY. As per convention, the Federal Reserve will release a new Summary of Economic Projections or SEP after this week’s meeting. The so-called “dot plot” will be watched very closely for changes to policymakers’ federal funds rate projections over the year-end 2022-2024 horizon. The September SEP indicated that participants at that meeting were equally divided over the prospect of raising administered rates by the end of next year, as seen in this chart of their end-of-year projections. The nominal federal funds rate anticipated by FOMC participants over the longer run likely will remain at 2.5%.
CHART 2 UPPER RIGHT
Source: Federal Reserve Board; FHLBNY. As of this writing, evident in this companion chart to Chart 1, market participants expect the first 25 bps hike (RHS is Fed Funds rate in %, LHS is number of hikes) in the Federal Funds rate target range to occur at next June’s gathering and to be followed by almost two additional increases before the end of 2022. As mentioned above, the FOMC’s “longer-run” projection for fed funds is 2.5%. The market, however, currently prices (via Fed Funds futures and OIS curve) for a quicker and shallower path of tightening, with a terminal rate in the ~1.50-1.60% zone. In this sense, the market apparently expects forthcoming hikes to arrest inflationary forces and lead to a slowing economic growth trend which will then place the Fed back on pause. This pricing has been a driver of the recent flattening trend in the yield curve. It will be interesting to compare these projections and pricing after the release of the fresh “dot plot” and related Fed commentary.
CHART 3 LOWER LEFT
Source: Bloomberg. Note: Top pane is yield (%), bottom pane is change (bps). As of midday Friday, yields were higher across the board week-over-week, with some retracement of the prior weeks’ flattening trend. For most of the week, the market traded with a “relief tone” regarding Covid news, as stocks bounced higher. Meanwhile, a slug of UST issuance in 10 and 30-year generated some upward pressure on the longer-end yields. Corporate debt issuance hit a record for December, also adding upward pressure to yields. The 3-year was ~10 bps higher, as Fed hikes were priced a bit more strongly into the curve; it should be noted, however, that ~3.6 bps of this move was due to the shift in the “on the run” UST to the newly issued, and higher yielding, December 2024 security. With the January 2023 Fed Funds future trading at .735%, the curve currently prices for ~2.6 Fed hikes of 25 bps each by the end of 2022.
CHART 4 LOWER RIGHT
Source: Bloomberg. It appears likely that the Fed will double reductions in net purchases of USTs to $20bn/month and pare those of MBS by $10bn/month in the middle of January. This quicker taper pace would end the Federal Reserve’s net securities-purchase program three months earlier in March. Beyond that point, as was the case in 2014, the Fed will likely continue to reinvest principal payments from its holdings of MBS and roll over maturing USTs at auctions. For a reminder and perspective on the scale and effect of the Fed’s buying, aka Quantitative Easing (QE), program, shown here is the Fed’s securities holdings (white line, RHS, $bn) vs. the 10-year UST yield (gold line, LHS, %). At ~$8.1trn, it has clearly been a historic program of financial accommodation and infusion of cash/liquidity to the financial and banking systems. Its tapering will begin the gradual removal of this process and its impacts.
FHLBNY Advance Rates Observations
Front-End Rates
- Short-end Advance rates week-over-week were unchanged through 2-month and then 1 to 4 bps higher thereafter. The 6-month was 4 bps higher. Note that these longer maturities in the short-end now overlap with the time period that the market prices for Fed hikes, and so some upward pressure is a result. With the debt ceiling issue seemingly resolved, there was some mild upward pressure on T-bill yields, and there is expectation that net bill issuance will move positive for a few months as Treasury aims to rebuild their TGA cash balances. While these trends will somewhat change the short-end’s supply/demand dynamic, there is still ample demand for short paper. Demand for the Fed’s RRP, which stands last at ~$1.5trn and near the record high of $1.6trn, remains strong. Money market funds’ AUM increased ~$14bn last week to a record high. With year-end looming, meanwhile, some investors have steered funds to the safety of the short-end.
- UST issuance overall is now net positive supply in that more is being issued than what the Fed is buying in its programs. However, with short UST rates at rock-bottom levels and the Fed on hold very near-term, the shortest tenor rates are likely to persist in a near-term sideways pattern. T-bills are expected to experience an issuance increase, but this uptick should not alter the overall money markets picture. To reiterate, as time ensues and maturities cross into spring/summer 2022, a timeframe that the market is pricing a strong probability of rate hikes, these maturities’ rates are likely to experience some upward drift.
Term Rates
- The advance curve mimicked the UST curve, with rates up across the board and some retracement of prior weeks’ flattening trend. For instance, while 2-year was ~5 bps higher, 5-year finished ~9 higher and 10-year ~13 bps higher. Kindly refer to the previous slide for relevant market color. On the UST supply front, this week provides a reprieve. The market eagerly awaits the December 15 FOMC outcome and commentary.
New Product Alert: FHLBNY is pleased to announce the launch of the Business Development Advance (BDA) on Thursday, November 4, 2021. The BDA is a 0% advance to help our members provide funding to qualifying small businesses to promote community & economic growth. The BDA is subsidized funding in the form of interest-rate credits. There is a total of $3 million of interest-rate credits available in 2021. Members can request to reserve their interest-rate credits up to $50,000 on a first-come/first-served basis. For further details, please view our BDA overview page and watch this past Thursday’s BDA webinar, and/or contact the Member Service Desk at 1-800-546-5101 option 1.
The Symmetrical Prepayment Advance Feature
With rates at or near multi-year lows, it is a compelling juncture to use the SPA feature on term advances. This feature allows member to capture, at prepayment, changes in the Fair Value of the advance which are favorable to the member. Contact us to discuss.
Looking for more information on the above topics? We’d love to speak with you!
Questions?
If you wish to receive the MSD Weekly Market Update in .pdf format (includes FHLBNY rate charts) or to discuss this content further, please email the MSD Team.