Member Services Desk
Weekly Market Update
Economist Views
Click to expand the below image.
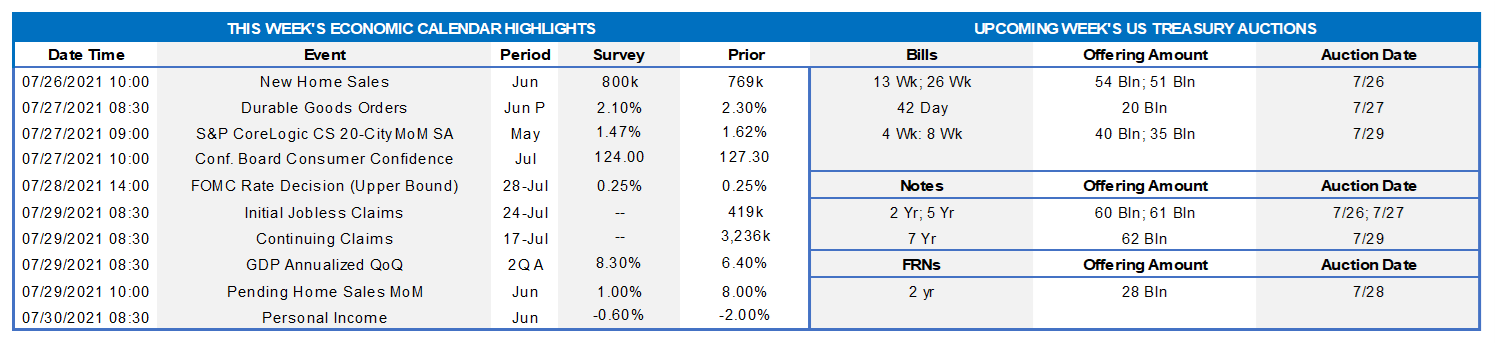
The Federal Open Market Committee (FOMC) meeting will be the marquee event of a busy week. The FOMC is expected to reiterate that it expects to maintain an accommodative policy stance, with a federal funds rate target range of 0 to .25%, until it achieves maximum employment and inflation at a rate of 2% over the longer run. The communiqué probably will also repeat that the Fed will continue to increase its holdings of UST’s by at least $80bn per month and of agency MBS by at least $40bn per month until substantial further progress has been made toward those goals. Growing confidence about the durability of the economic expansion expressed by Fed officials in recent public appearances hints that a prospective tapering of securities purchases may be discussed at this week’s meeting. Barring any adverse developments, a timeline for curtailing additions to the System Open Market Account could be announced in the fall to commence early next year. On the economic calendar are updates on new home sales, home prices, durable goods orders, and the Bureau of Economic Analysis’ advance report on Q2 real GDP.
New Home Sales: Contracts to purchase a newly constructed dwelling probably jumped by 6.6% to a three-month high seasonally adjusted annual rate of 820K in June.
Durable Goods Orders: Powered by an anticipated increase in transport equipment bookings, orders likely rose 2% in June, almost matching the 2.3% gain posted in May. Last month’s nondefense capital goods shipments excluding commercial jet deliveries will allow economists to finalize their projections on the contribution of business equipment spending to Q2 real GDP growth.
S&P CoreLogic Case-Shiller (SPCLCS) 20-City Home Price Index: Home prices probably posted yet another solid gain in May across the twenty major metropolitan areas canvassed by SPCLCS. Indeed, the 1.5% increase anticipated by the Street in May, following a 1.6% rise in April, would place home selling prices a hefty 16.4% above their prior-year level.
Conference Board Consumer Confidence: The recent acceleration in inflation is evidently taking a toll on consumers’ spirits. Echoing deteriorations in weekly sentiment soundings, the Index probably tumbled to a 3-month low of 118.5 in July from 127.3 in the preceding month. Pay attention to the so-called labor differential – the percentage of survey respondents feeling that jobs are plentiful less than those believing they are hard to get – for clues to any change in the civilian jobless rate in July.
Real GDP: Real GDP is expected to have accelerated further during the spring from Q1’s 6.4% annualized pace. While the range of available estimates is wide, the median call for an 8.2% annualized gain implies that the output lost to the pandemic was fully recovered over the April-June span. This week’s report will also include revisions of the National Economic Accounts back to 1999.
Jobless Claims: Initial and continuing claims under regular state unemployment insurance programs probably declined over their latest respective reporting periods. Those figures continue to overstate the recovery of hiring from the healthcare crisis, however. Indeed, as of the week ended July 3, an estimated 12.6mn persons were receiving some sort of unemployment assistance, down from the pandemic peak of 32.4mn reached a year ago but still well above the 2.1mn prevailing before the shuttering of the economy. Using June’s level as a base, 7.8% of the civilian labor force were receiving some form of unemployment insurance payments at the beginning of this month.
Pending Home Sales: Still constrained by the dearth of available dwellings on the market nationwide, contract signings are expected to have edged .5% higher in June, after the surprising 8% jump recorded in May. The estimated strength in pending home sales over the latest two months, if realized, would be consistent with a 2.4% increase in existing home purchases to a four-month high seasonally adjusted annual rate of 6mn in the National Association of Realtors’ July report.
Federal Reserve Appearances:
- July 28 FOMC monetary policy communiqué released.
- July 28 Federal Reserve Chair Jerome Powell to hold press conference following FOMC meeting.
Click to expand the below images.
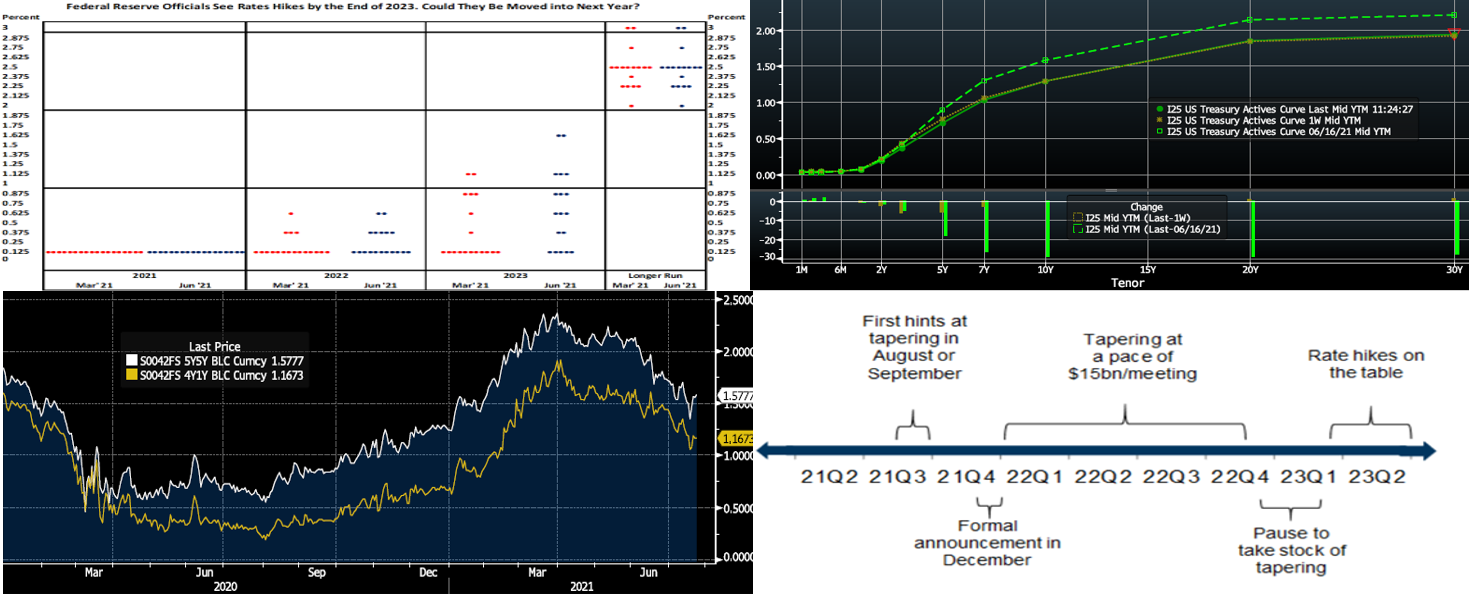
CHART 1 UPPER LEFT
Source: Federal Reserve Board; FHLBNY. As per convention, the Federal Reserve released an updated Summary of Economic Projections after the June FOMC meeting. The updated “dot plot” revealed that the median federal funds rate forecast now anticipates 50 bps of tightening by the end of 2023. The next update will be released following the September 21-22 meeting. Given recent pickups in real economic activity and consumer price inflation, only two policymakers would need to become marginally more hawkish to bring the initial rate hike forward into next year. It bears noting that Federal Reserve officials continue to believe that, over the “longer-run”, the nominal federal funds rate should be 2.5%. Given no updated “dot plot” forthcoming from the FOMC this week, there will be intense focus on the topic of tapering securities purchases.
CHART 2 UPPER RIGHT
Source: Bloomberg. Note: top pane is yield (%), bottom pane is change (bps). The curve was modestly changed week-on-week and remains notably flatter since the June 16th FOMC. As of midday Friday, UST yields week-over-week were 2 to 5 bps lower out to 5-year, led by the 4 to 5-year sector, and then unchanged to a bp or two higher in the longer end. It should be noted, however, that rates dipped markedly early in the week in tandem with declining stocks, apparently a move attributed to heightened concerns about the Delta COVID variant and a last round of short-covering and “curve steepener” unwinds from trading-type market participants. Markets subsequently stabilized in the back half of the week, with stocks reaching fresh record highs. As an example of the intraweek moves in yields, the UST 5-year dipped to .631% early Tuesday but then climbed higher in the following days to .715% as of midday Friday. As mentioned in previous editions, members with term borrowing interest/potential can take advantage of these dips in rates to lock in more attractive rates; please engage the desk for color and guidance and note that live Advance rates are available well before the Daily Rate Sheet hits your inbox each morning.
CHART 3 LOWER LEFT
Source: Bloomberg. Portrayed here are the 5-year, 5-year forward and 1-year, 4-year forward OIS (Overnight Index Swap) rates (RHS,%); OIS rates can be viewed as a proxy for the term Fed Funds curve. As mentioned above regarding the “dot plot”, the Fed continues to believe that the “longer-run” target for Fed Funds is 2.5%. But market pricing of “longer-run” rates are clearly well below this level, reflecting the notable curve flattening of the past six weeks. Given current economic and Fed projections, and absent more severe bad COVID news, these rate levels (and the rates complex in general) might appear poised to bounce further above their recent lows of early this past week.
CHART 4 LOWER RIGHT
Source: Goldman Sachs Research. As noted previously herein, the market will train their focus at this week’s FOMC to any talk of tapering securities purchases. Depicted here is the forecasted tapering timeline from Goldman; it largely coincides with the forecasts of many dealers and investment firms in the market. Most market participants do no expect the Fed to address the taper topic in detail this week but expect it to hint more forcefully in autumn that it is on the way and to be followed by an announcement late in the year. Any surprise “pulling forward” of this timeline would likely spark a backup in rates and Fed Funds rate hikes priced into the nearer future.
FHLBNY Advance Rates Observations
Front-End Rates
- Short-end Advance rates finished mostly unchanged on the week. Money Market Funds’ AUM increased by ~$8.1bn this past week, thereby adding demand for paper. The overall supply/demand paradigm persists in suppressing rate levels, as the GSEs continue to invest larger sums into money markets, the TGA continues its decline, and short-maturity paper is in short supply. The Fed’s RRP facility continues to experience strong demand. In a more recent development, state and local governments have received federal disbursements from the most recent relief bill and are parking funds in short-term investment “placeholders”. For any members experiencing such municipal deposit inflows, consider our Refundable Municipal Letter of Credit product; please call the Member Services Desk to discuss.
- UST issuance overall is now net positive supply in that more is being issued than what the Fed is buying in its programs. However, with short UST rates at rock-bottom levels and the Fed on hold for a long period, rates are likely to persist in a near-term sideways pattern. Importantly, weekly net T-bill issuance has been lower since 2020 and negative in recent months, and Treasury intends to shift issuance out the curve. Moreover, the looming federal debt ceiling may further constrain issuance. More legislative packages and related borrowing may lead to an eventual increase of T-bill auction sizes and positive net supply, but for now overall market supply/demand dynamics should keep short rates in check from large moves to the upside.
Term Rates
- The Advance rate curve mildly steepened from a week prior. Rates out to 5-year were ~2 to 6 bps lower, led by the 4 to 5-year; rates 6-year and longer were modestly changed to a bp or two higher. Kindly refer to the previous section for further color on relevant market dynamics.
- On the UST supply front, this week brings 2/5/7-year auctions. An uptick in corporate bond issuance is likely post-earnings releases. The week’s main event is the FOMC; the market will pay close attention to the taper topic.
New Product Alert: In order to satisfy member needs and provide greater product flexibility to match bond and derivative market conventions, FHLB-NY now offers SOFR-linked advances based on SOFR-index compounding. Note that this product is in addition to SOFR-linked advances based on SOFR-index averaging which have been offered since November 2018.
The Symmetrical Prepayment Advance Feature
With rates at or near multi-year lows, it is a compelling juncture to use the SPA feature on term advances. This feature allows member to capture, at prepayment, changes in the Fair Value of the advance which are favorable to the member. Contact us to discuss.
Looking for more information on the above topics? We’d love to speak with you!
Questions?
If you wish to receive the MSD Weekly Market Update in .pdf format (includes FHLBNY rate charts) or to discuss this content further, please email the MSD Team.
Special Member Alert
The FHLBNY recently announced a newly expanded and flexible Disaster Relief Funding (DRF) advance program which offers discounted rate advances with maturities 1-mo and greater. Additionally, we have announced that PPP loans will be accepted as eligible collateral. Please contact us with any questions.