Member Services Desk
Weekly Market Update
This MSD Weekly Market Update reflects information for the week of November 23, 2020.
Economist Views
Click to expand the below image.
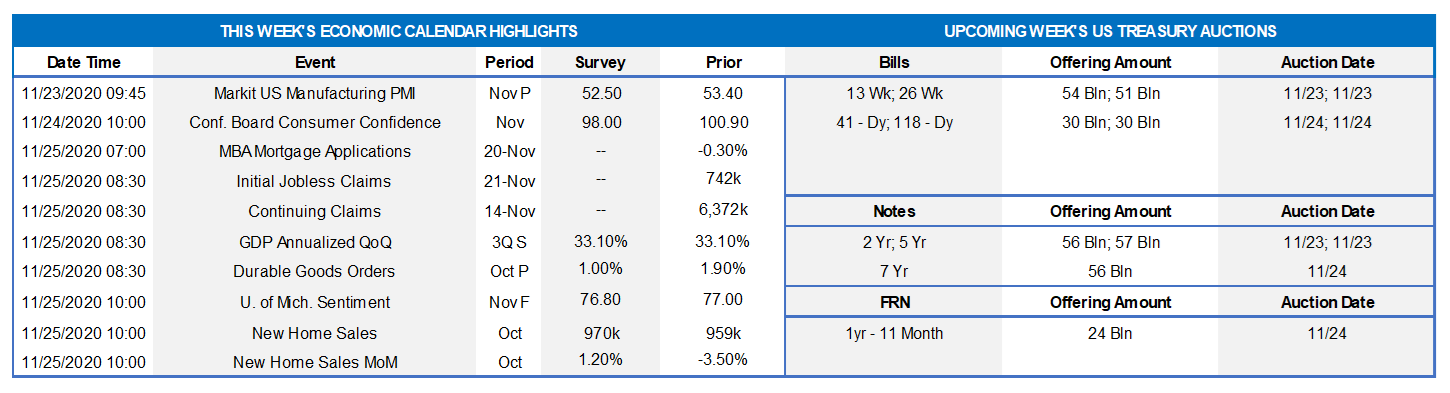
Market participants will face a crowded economic release calendar ahead of the Thanksgiving holiday. Home prices and durable goods bookings probably remained on uptrends in their respective reporting periods. Consumer confidence likely rebounded, while solid demand for dwellings propelled new home purchases to their highest level in 14 years. Data now in hand hint that Q3 real GDP growth may be headed for an upgrade. A quartet of Federal Reserve officials are slated to make public appearances to discuss a variety of topics.
S&P CoreLogic Home Price Index: Buoyed by solid demand, home prices are expected to have accelerated across the 20 metropolitan areas covered by the S&P CoreLogic Home Price Index in September. The 0.7% median consensus projection, if realized, would place prices received by sellers 5.2% above their year-ago level.
Conference Board Consumer Confidence: Supported by ongoing improvements in labor-market conditions, the Conference Board’s sentiment gauge likely rebounded to an eight-month high of 102.5 in November. Pay particular attention to the labor differential – the percentage of respondents noting that jobs are plentiful less those believing positions are hard to get – for clues to any changes in the civilian unemployment rate in the Bureau of Labor Statistics’ upcoming report.
Advance Goods Trade Deficit: Prompted by an anticipated pickup in imports, the merchandise trade deficit is expected to widen from the $79.4bn shortfall recorded in September.
Durable Goods Orders: Durable goods bookings are expected to climb for a sixth straight month in October. The 0.9% gain projected by the Street would boost the cumulative rise since April’s pandemic low to a hefty 43%. Last month’s non-defense capital goods shipments excluding jetliners will provide important information on business equipment spending at the start of the fourth quarter.
Real GDP Growth: Updated data since the Bureau of Economic Analysis’ advance estimate point to a modest upward revision to real GDP growth during the summer quarter from the originally reported 33.1% annualized pace.
New Home Sales: Recent readings on single-family building permits and housing starts hint that new home sales probably rebounded sharply in October, topping a SAAR of 1mn dwellings for the first time since November 2006. With the number of newly constructed dwellings on the market failing to keep pace with contract signings during the reference period, the months’ supply of unsold homes likely dipped to a new record low.
Federal Reserve Appearances:
Nov. 23: Richmond Fed President Barkin to speak about economy in an online forum.
Nov. 23: San Francisco Fed President Daly to discuss future of cities after pandemic.
Nov. 23: Chicago Fed President Evans to take part in a moderated Q&A on economy.
Nov. 24: St. Louis Fed President Bullard to discuss monetary policy challenges.
Nov. 24: Minutes of November 4-5 FOMC meeting to be released.
Click to expand the below images.
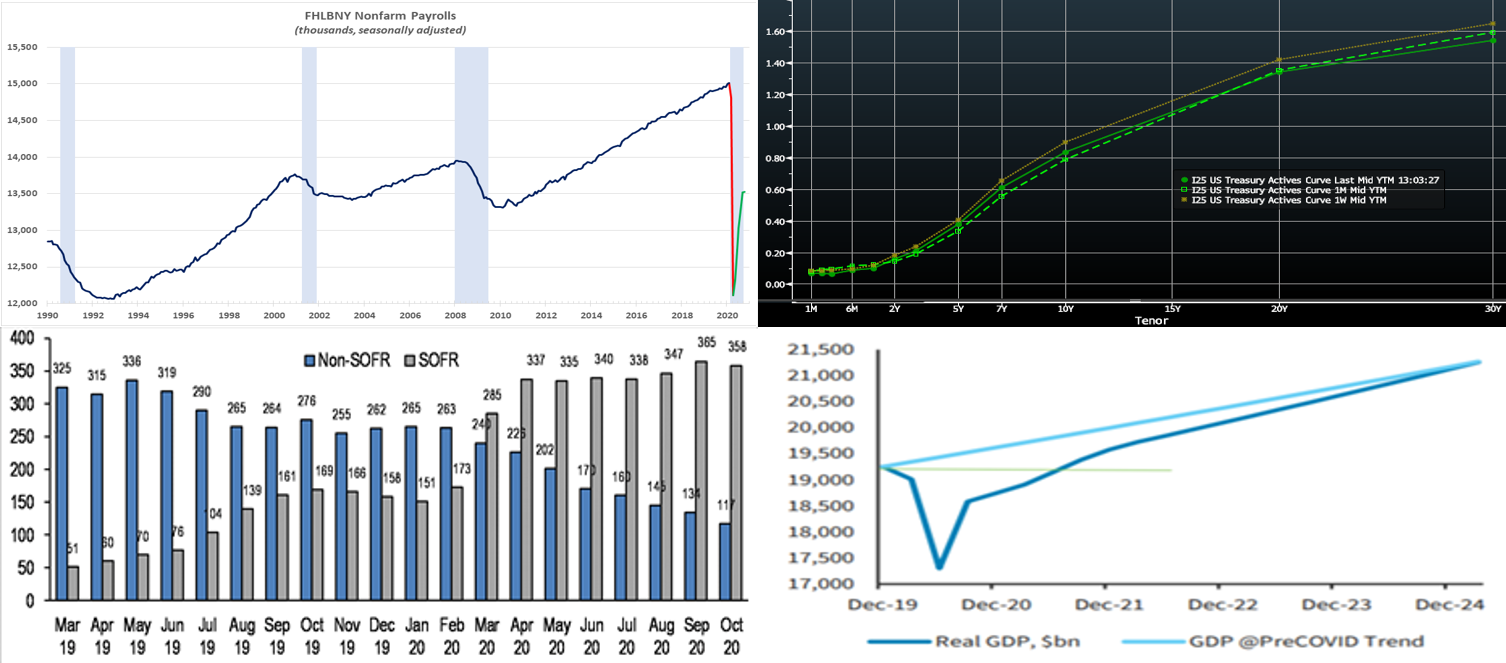
CHART 1 – UPPER LEFT
Source: BLS; FHLBNY. Hiring ground to a near halt in the FHLB-NY district in October. Indeed, New York, New Jersey, Puerto Rico, and the Virgin Islands added just 7.7K net new jobs, following an upwardly revised 248.7K (was 172.1K) jump in September. While 54.5% of the 22.2mn positions lost nationwide in the pandemic’s wake have been recouped, the recovery in the FHLB-NY coverage area has been considerably slower. Indeed, the two states and territories have expanded headcounts by 1.41mn since April, thereby accounting for only a 48.8% recovery of the 2.9mn jobs lost.
CHART 2 – UPPER RIGHT
Source: Bloomberg. The UST curve “bull flattened” the past week and now rests close to its level of a month ago. Last week’s vaccine news ended the “pandemic in perpetuity” gloom, but indications are still that the vaccine process can last well into 2021 before there is mass vaccination or any “all-clear”. In the meantime, Covid-19 trends have worsened over the past week. Consequently, rates and the curve have now essentially retraced the initial move from the vaccine news. Thursday’s announcement by Treasury regarding its intent to end emergency Fed lending programs, as well as requesting funds back from the Fed, also served to push rates lower; it also seemed to aggravate Fed Chairman Powell who favors the “backstop/safety-net/signal” effect of the programs. The Fed’s guidance and programs have served to pin the shorter maturities, and so again maturities past 4-year led the week’s movements.
CHART 3 – LOWER LEFT
Source: iMoneyNet; JP Morgan. Depicted here is Floating Rate Note (FRN) exposures (in $bn) in government money market funds (MMFs), SOFR-linked vs. non-SOFR. Clearly, SOFR has become the dominant index in this sector over the past year, and FHLB is one of the largest issuers of this product. With SOFR markets continuing to evolve and grow, it is important for institutions to prepare accordingly for Libor-cessation and further SOFR development. Please speak to the desk for more information/guidance on SOFR.
CHART 4 – LOWER RIGHT
Source: Barclays Research. While the economy has certainly experienced a bounce-back from the depths of the pandemic and lockdown period of spring, this chart provides some perspective on the recovery and the opportunity cost of the economic downturn. While activity may return to normal, or “get back to where it was pre-pandemic” in the second half next year, a fuller recovery will take many more years when viewed through the lens of what trend growth could have been, i.e. the opportunity cost, absent the pandemic. Hence, the Fed continues to signal low rates for the foreseeable future and to advocate for further fiscal relief.
FHLBNY Advance Rates Observations
Front-End Rates
Short-end Advance rates finished 2 to 4 bps lower week-over-week. T-bill issuance was a market feature, as usual, but net supply has slowed and thereby allowed for easier market absorption. Helping the move lower in rates was a $9.6bn inflow to Government-Only money market funds on the week. Also assisting the move has been an overall moderation in market supply of short paper in recent months. Lastly, funds received from mortgage prepayments have been placed into the short-end of the market by institutions such as Freddie Mac and FNMA.
Heavy T-Bill issuance will remain a theme; UST issuance overall is now net positive supply in that more is being issued than what the Fed is buying in its programs, and so this scenario could prove a small challenge. However, with short UST rates at rock-bottom levels, and the Fed likely on hold for a long period, rates may trade in a sideways to slightly lower pattern. Net T-bill issuance has been lower since mid-summer and even negative in recent weeks, and Treasury has announced plans to shift issuance out the curve, but a new fiscal relief package could complicate/alter this forecast. Market sentiment thus far towards election outcomes is that the probability of very large fiscal legislation has been reduced, thereby leading to less T-bill supply.
Term Rates
Medium and longer-term Advance rates were 3 to 8 bps lower in progressive fashion out the curve, in a “bull flattener” move, on the week. Rates 3-year and shorter generally remain pinned in a narrow range, and so again it was the portion of the curve thereafter that led the week’s change. Please refer to the previous section for further color on the market moves.
Rates still trade at historically low levels across the yield curve, and the curve is priced for the Fed to be on hold for several years. If suitable or sensible from an ALM perspective, it may be worthwhile to consider extending liabilities and locking in term rates. Please call the Member Services Desk to discuss rate levels and potential ideas.
On the UST supply front, this week brings 2/5/7-year auctions in a short week. Corporate issuance should add yet again to its historic record annual pace albeit slower in the holiday week. Attention will remain on the prospect of further relief legislation and certainly also on COVID-19 developments which have been notably worsening. Happy Thanksgiving to our readers!
The Symmetrical Prepayment Advance Feature
With rates at or near multi-year lows, it is a compelling juncture to use the SPA feature on term advances. This feature allows member to capture, at prepayment, changes in the Fair Value of the advance which are favorable to the member. Contact us to discuss.
Looking for more information on the above topics? We’d love to speak with you!
Questions?
If you wish to receive the MSD Weekly Market Update in .pdf format (includes FHLBNY rate charts) or to discuss this content further, please email the
MSD Team.
Special Member Alert
The FHLBNY recently announced a newly expanded and flexible Disaster Relief Funding (DRF) advance program which offers discounted rate advances with maturities 1-mo and greater. Additionally, we have announced that PPP loans will be accepted as eligible collateral. Please contact us with any questions.