Member Services Desk
Weekly Market Update
This MSD Weekly Market Update reflects information for the week of August 9, 2021.
Economist Views
Click to expand the below image.
The July employment report was a blowout. Not only did hiring eclipse the median expectation, but also previously posted figures for both May and June were marked higher. With over 1mn persons finding work in the household survey, the unemployment rate dropped from 5.9% to 5.4% and nearer to the 4.5% anticipated by Fed officials at yearend. Moreover, jobless measures for specific segments of the population showed even greater improvements during the reference period. Wage gains eclipsed expectations and were widely spread across industries. Total hours worked by private employees posted yet another solid gain, hinting at another quarter of well-above-trend real GDP growth. Following a hectic economic release calendar to begin in August, the data flow will slow considerably this upcoming week. Reflecting the currently tight demand for labor, job openings likely reached a new peak in June. Both small business and consumer confidence gauges probably improved in their latest respective reporting periods. Consumer price inflation measures probably slowed in July from the surprisingly rapid paces experienced in June yet remained well above the Federal Reserve’s desired 2% target on a year-to-year basis. A sharp acceleration in total hours worked is expected to have capped nonfarm productivity growth during the spring quarter, while unit labor costs slowed as well. The median consensus projection for current-quarter real GDP growth anticipates a 7.1% annualized gain, up from the spring’s 6.5% advance. Federal Reserve officials will make half a dozen public appearances this week to discuss a variety of topics.
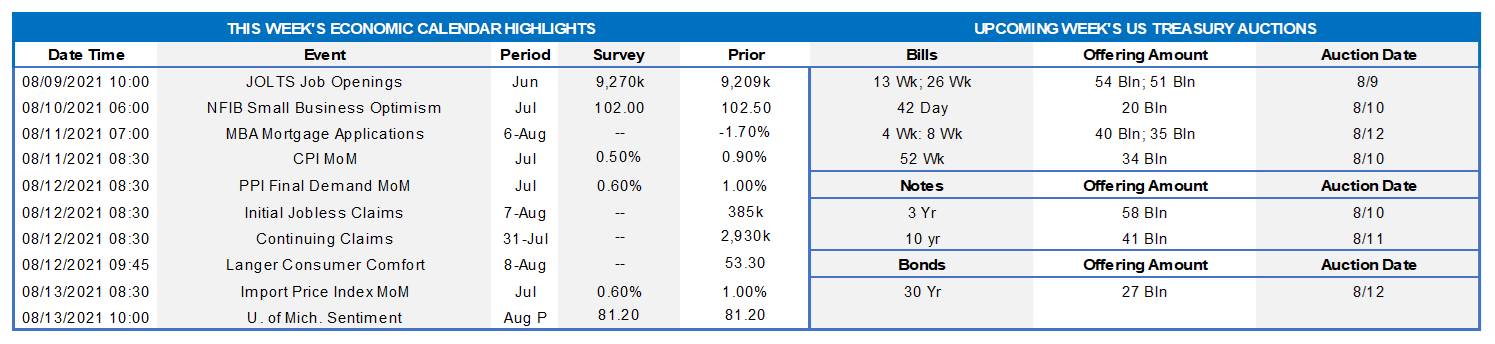
JOLTS Job Openings: A reported rebound in online help-wanted postings suggests that total job openings reached yet another record high in June. If the median Street projection of 9.26mn is on the mark, the gap between the unemployed and available positions will have narrowed to just 224K – down from the pandemic wide of 18.5mn set in April 2020.
NFIB Small Business Optimism Index: Echoing other sentiment surveys, the National Federation of Independent Business’ optimism gauge probably improved upon June’s 102.5 reading.
Nonfarm Productivity & Costs: Capped by a pickup in total hours worked by employees, productivity probably expanded at an annual rate of 3.4% during Q2, following a 5.4% rise in Q1. Despite the anticipated slowdown in output per hour, unit labor cost growth likely decelerated to .9% annualized over the April-June period, down from 1.7% during the first three months of the year.
Consumer Price Index: Reflecting a broadly based slowdown in core retail goods and services costs, the Consumer Price Index (CPI) likely rose by .5% in July, after the surprising .9% jump posted in June. Excluding anticipated movements in food and energy prices during the reference period, the core CPI probably climbed by .4%, following a .9% prior-period increase. The median Street projections, if realized, would place the overall and core CPIs 5.3% and 4.3% above their respective year-ago levels. Keep in mind that, while currently well above the Fed’s 2% target, PCE inflation gauges that adjust for changes in the composition of consumers’ purchases are running about one-percentage point below their corresponding CPI measures.
Jobless Claims: Initial and continuing claims under regular state unemployment insurance programs likely retreated during their latest respective reporting periods. While followed closely by market participants, those figures continue to overstate the improvement in the labor market from the worst of the pandemic. Indeed, as of the week ending July 17, almost 13mn persons were still receiving some sort of unemployment assistance, down from the pandemic peak of 32.4mn reached a year ago but still well above the 2.1mn prevailing before the shuttering of the economy. Using June’s level as a base, 8.0% of the civilian labor force were receiving some form of unemployment insurance payments at the middle of last month.
Michigan Consumer Sentiment Index: Weekly soundings suggest that the U of M’s consumer confidence barometer probably climbed to 83 in early August from 81.2 in the previous month.
Federal Reserve:
- Aug. 9 Richmond Fed President Barkin to discuss the economic outlook before Roanoke Regional Chamber of Commerce.
- Aug. 11 NY Fed Executive VP Lorie Logan to take part in a discussion on the lessons for emergency lending by the BIS.
- Aug. 11 Atlanta Fed President Bostic to discuss the central bank’s role in making an economy that works for everyone.
Click to expand the below images.
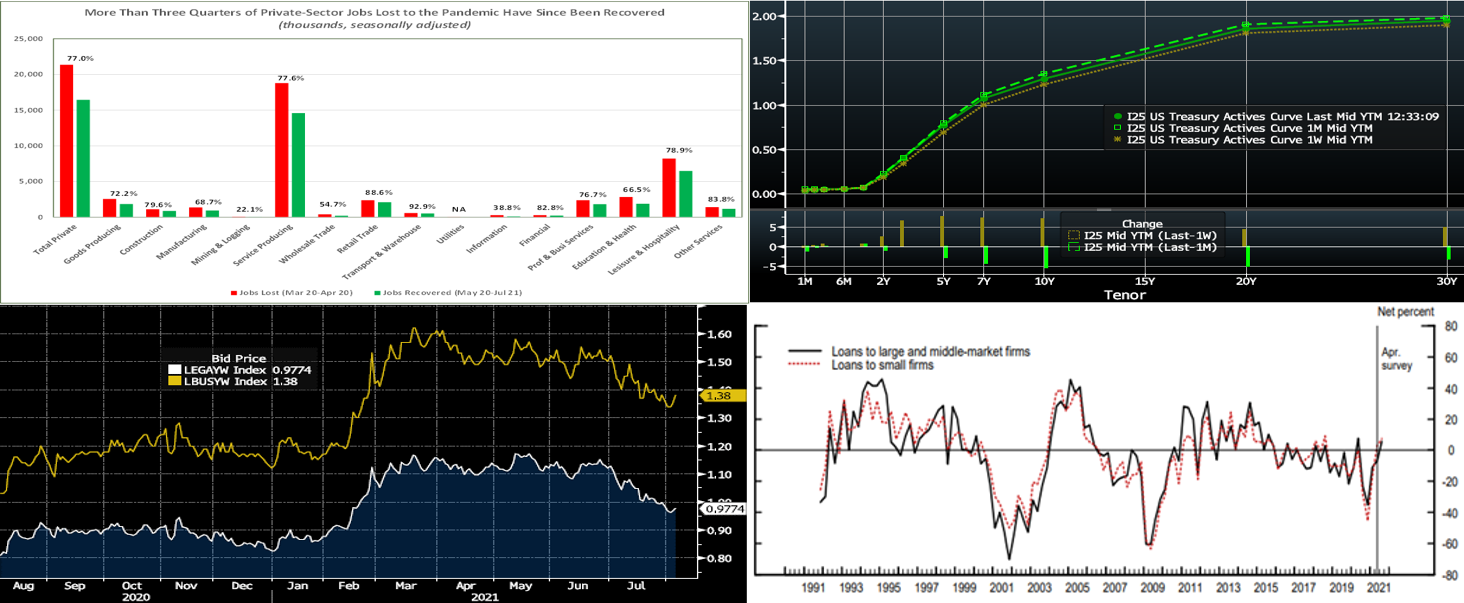
CHART 1 UPPER LEFT
Source: BLS; FHLB-NY. The Bureau of Labor Statistics reported that nonfarm payrolls leaped by 943K in July, following upwardly revised increases of 938K in June and 614K in May. Well above the 870K market expectation, last month’s rise marked the strongest net hiring since the 1.58mn positions added last August. To date, 16.7mn, or 74.5%, of the 22.4mn nonfarm jobs lost in March-April 2020 have been recovered. Assuming further progress on the pandemic, the hardest-hit service-producing sectors likely will improve further. On another optimistic note, the Conference Board’s so-called labor differential – the percentage of consumers believing that jobs are plentiful less than those feeling that positions are hard to get – widened from 21.6% in April to a 21-year high of 44.2% last month, just two points shy of the 46.2% record set in July 2000. Federal Reserve policymakers currently anticipate that the jobless rate will trend lower from 5.4% in July to 4.5% by the final quarter of 2021.
CHART 2 UPPER RIGHT
Source: Bloomberg. Note: top pane is yield (%), bottom pane is change (bps). Led by the belly, the yield curve pushed higher week-on-week and nearer to levels of a month ago. As of midday Friday, UST yields week-over-week were 2 to 6 bps higher out to 4-year, 6 to 8 bps higher in the 5 to 10-year sector, and then 4 to 5bps higher in the very long end. The move occurred almost solely on Friday after the release of the strong jobs report prompted the pricing of a slightly higher probability of an earlier removal of accommodation by the Fed. Per the prior week’s FOMC, the Fed has engaged in discussions on the timeline of tapering its securities purchases. While further progress is undoubtedly needed before the Fed decides to taper, the jobs report will enliven its discussions. The August jobs report will be released about three weeks before the Sept. 21-22 FOMC. An updated Summary of Economic Projections will be released at that time and only two Fed officials need to become marginally more hawkish to bring the median call for the first hike in administered rates into 2022. Adding to the jobs report’s impact on end of week trading was the imminent auction this upcoming week of 3/10/30-year USTs. The market will now monitor Fed officials’ reactions to and comments on the jobs report, in order to decipher policy timelines.
CHART 3 LOWER LEFT
Source: Bloomberg. Piggybacking on last week’s chart of global negative-yielding debt, depicted here is a comparison of U.S. and global yields, namely the Bloomberg Barclays U.S. Aggregate Yield-to-Worst index (RHS, yellow, %) vs. the Bloomberg Barclays Global Aggregate Yield-to-Worst index (RHS, white, %). The former is well above the latter, as has been the case in recent years. Reiterating from last week, a contributing factor to July’s decline in US yields is that persistently low and/or negative global yields continue to support foreign investor demand for US fixed income instruments and should help temper the severity of any “taper tantrum”-driven rates spike in reaction to the Fed’s eventual curtailment of securities purchases.
CHART 4 LOWER RIGHT
Source: FRB. Portrayed here is the “Net Percent of Domestic Respondents Reporting Stronger Demand for Commercial and Industrial Loans” from the Fed’s July 2021 Survey of Senior Loan Officers on Bank Lending Practices. In a hopeful sign, the measure has edged higher from April’s survey and just barely into positive territory. Regarding demand for C&I loans over Q-2, modest net shares of banks reported stronger demand from small and large and middle-market firms. Additionally, a significant net share of banks reported a higher number of inquiries from potential borrowers regarding the availability and terms of new credit lines or increases in existing lines over Q-2. Further progress on this front will be welcome news for bank net interest figures.
FHLBNY Advance Rates Observations
Front-End Rates
Short-end Advance rates finished mostly unchanged to a bp higher in the week. Money Market Funds’ AUM decreased by an uneventful ~$1.7bn this past week. The overall supply/demand paradigm persists in suppressing rate levels, as the GSEs continue to invest large sums into money markets, the TGA continues its decline, and the short-maturity paper is in short supply. The Fed’s RRP facility continues to experience strong demand. In a more recent development, state and local governments have received federal disbursements from the most recent relief bill and are parking funds in short-term investment “placeholders”. For any members experiencing such municipal deposit inflows, consider our Refundable Municipal Letter of Credit product; please call the member services desk to discuss.
UST issuance overall is now net positive supply in that more is being issued than what the Fed is buying in its programs. However, with short UST rates at rock-bottom levels and the Fed on hold for a long period, rates are likely to persist in a near-term sideways pattern. Importantly, weekly net T-bill issuance has been lower since 2020 and negative in recent months, and Treasury intends to shift issuance out the curve. Moreover, the looming federal debt ceiling may further constrain issuance. Further legislative packages and related borrowing may lead to an eventual increase of T-bill auction sizes and positive net supply, but for now, overall market supply/demand dynamics should keep short rates in check from large moves to the upside.
Term Rates
The Advance rate curve rose from a week prior. Rates out to 3-year were 1 to 2 bps higher; rates in the 5 to 10-year sector were 5 to 10bps higher in progressive fashion out the curve. Kindly refer to the previous section for further color on relevant market dynamics.
On the UST supply front, this week brings a heavy dose of 3/10/30-year auctions. A further uptick in corporate bond issuance is also likely post-earnings releases. The supply may weigh on the curve; indeed, this past Friday’s strong jobs report, with this supply on the immediate horizon, served to “bear steepen” the curve as of midday Friday. In the week ahead, the market will monitor Fed officials’ reactions to the jobs report.
Product Enhancement Alert: FHLBNY this past week announced an enhancement to the Callable Adjustable Rate Credit Advance (“Callable ARC”). The product features a 1-time call/cancel option (member’s option) to extinguish funding early at no cost via two distinct option structures, thereby giving members flexibility in meeting the demands of a fluctuating balance sheet. Given the shorter-term nature of the current borrowing environment, the minimum term for the Callable ARC has been lowered to 4-month (from the previous 7-month) for our 1-month-left-to-maturity call option (SOFR or 1-month Libor index available) to better meet our members’ needs. Meanwhile, the 3-year Non-Call 2-year product for SOFR continues to be offered to members for their longer-term needs.
New Product Alert: In order to satisfy member needs and provide greater product flexibility to match bond and derivative market conventions, FHLB-NY now offers SOFR-linked advances based on SOFR-index compounding. Note that this product is in addition to SOFR-linked advances based on SOFR-index averaging which have been offered since November 2018.
The Symmetrical Prepayment Advance Feature
With rates at or near multi-year lows, it is a compelling juncture to use the SPA feature on term advances. This feature allows member to capture, at prepayment, changes in the Fair Value of the advance which are favorable to the member. Contact us to discuss.
Looking for more information on the above topics? We’d love to speak with you!
Questions?
If you wish to receive the MSD Weekly Market Update in .pdf format (includes FHLBNY rate charts) or to discuss this content further, please email the MSD Team.
Special Member Alert
The FHLBNY recently announced a newly expanded and flexible Disaster Relief Funding (DRF) advance program which offers discounted rate advances with maturities 1-mo and greater. Additionally, we have announced that PPP loans will be accepted as eligible collateral. Please contact us with any questions.