Financial Intelligence
Despite Yield-Curve Inversions, Recession Appears A Long Way Off
Authored by Brian Jones, FHLBNY Financial Economist
Inverted Portions of the Treasury Yield Curve Have Heightened Fears of Impending Recession
Even before it became the longest expansion in U.S. history in July, the longevity of the current business cycle upturn prompted market participants and commentators to look for signs of its impending demise. With real business activity ambling along at an above-trend pace and few, if any, signs of weakness evident in high-frequency data, attentions turned to the slope of the Treasury yield curve as a precursor of coming recession (see charts below). The rate spread between the government’s 10-year note and 3-month bill inverted on a constant-maturity, bond-equivalent basis in late May and has moved deeper into negative territory since, but recent periodic inversions between the 10-year and 2-year maturities have been the focus of traders and investors. While true that the latter yield spread has had a longer lead time heading into the last three cyclical downturns, the temporary nature of the latest moves calls into question the veracity of the signal. Indeed, as of this writing, the constant-maturity, bond-equivalent rate at both maturities was 1.47%.
Exhibit 1: Selected Treasury Yields and Spreads (monthly average, bond-equivalent basis)
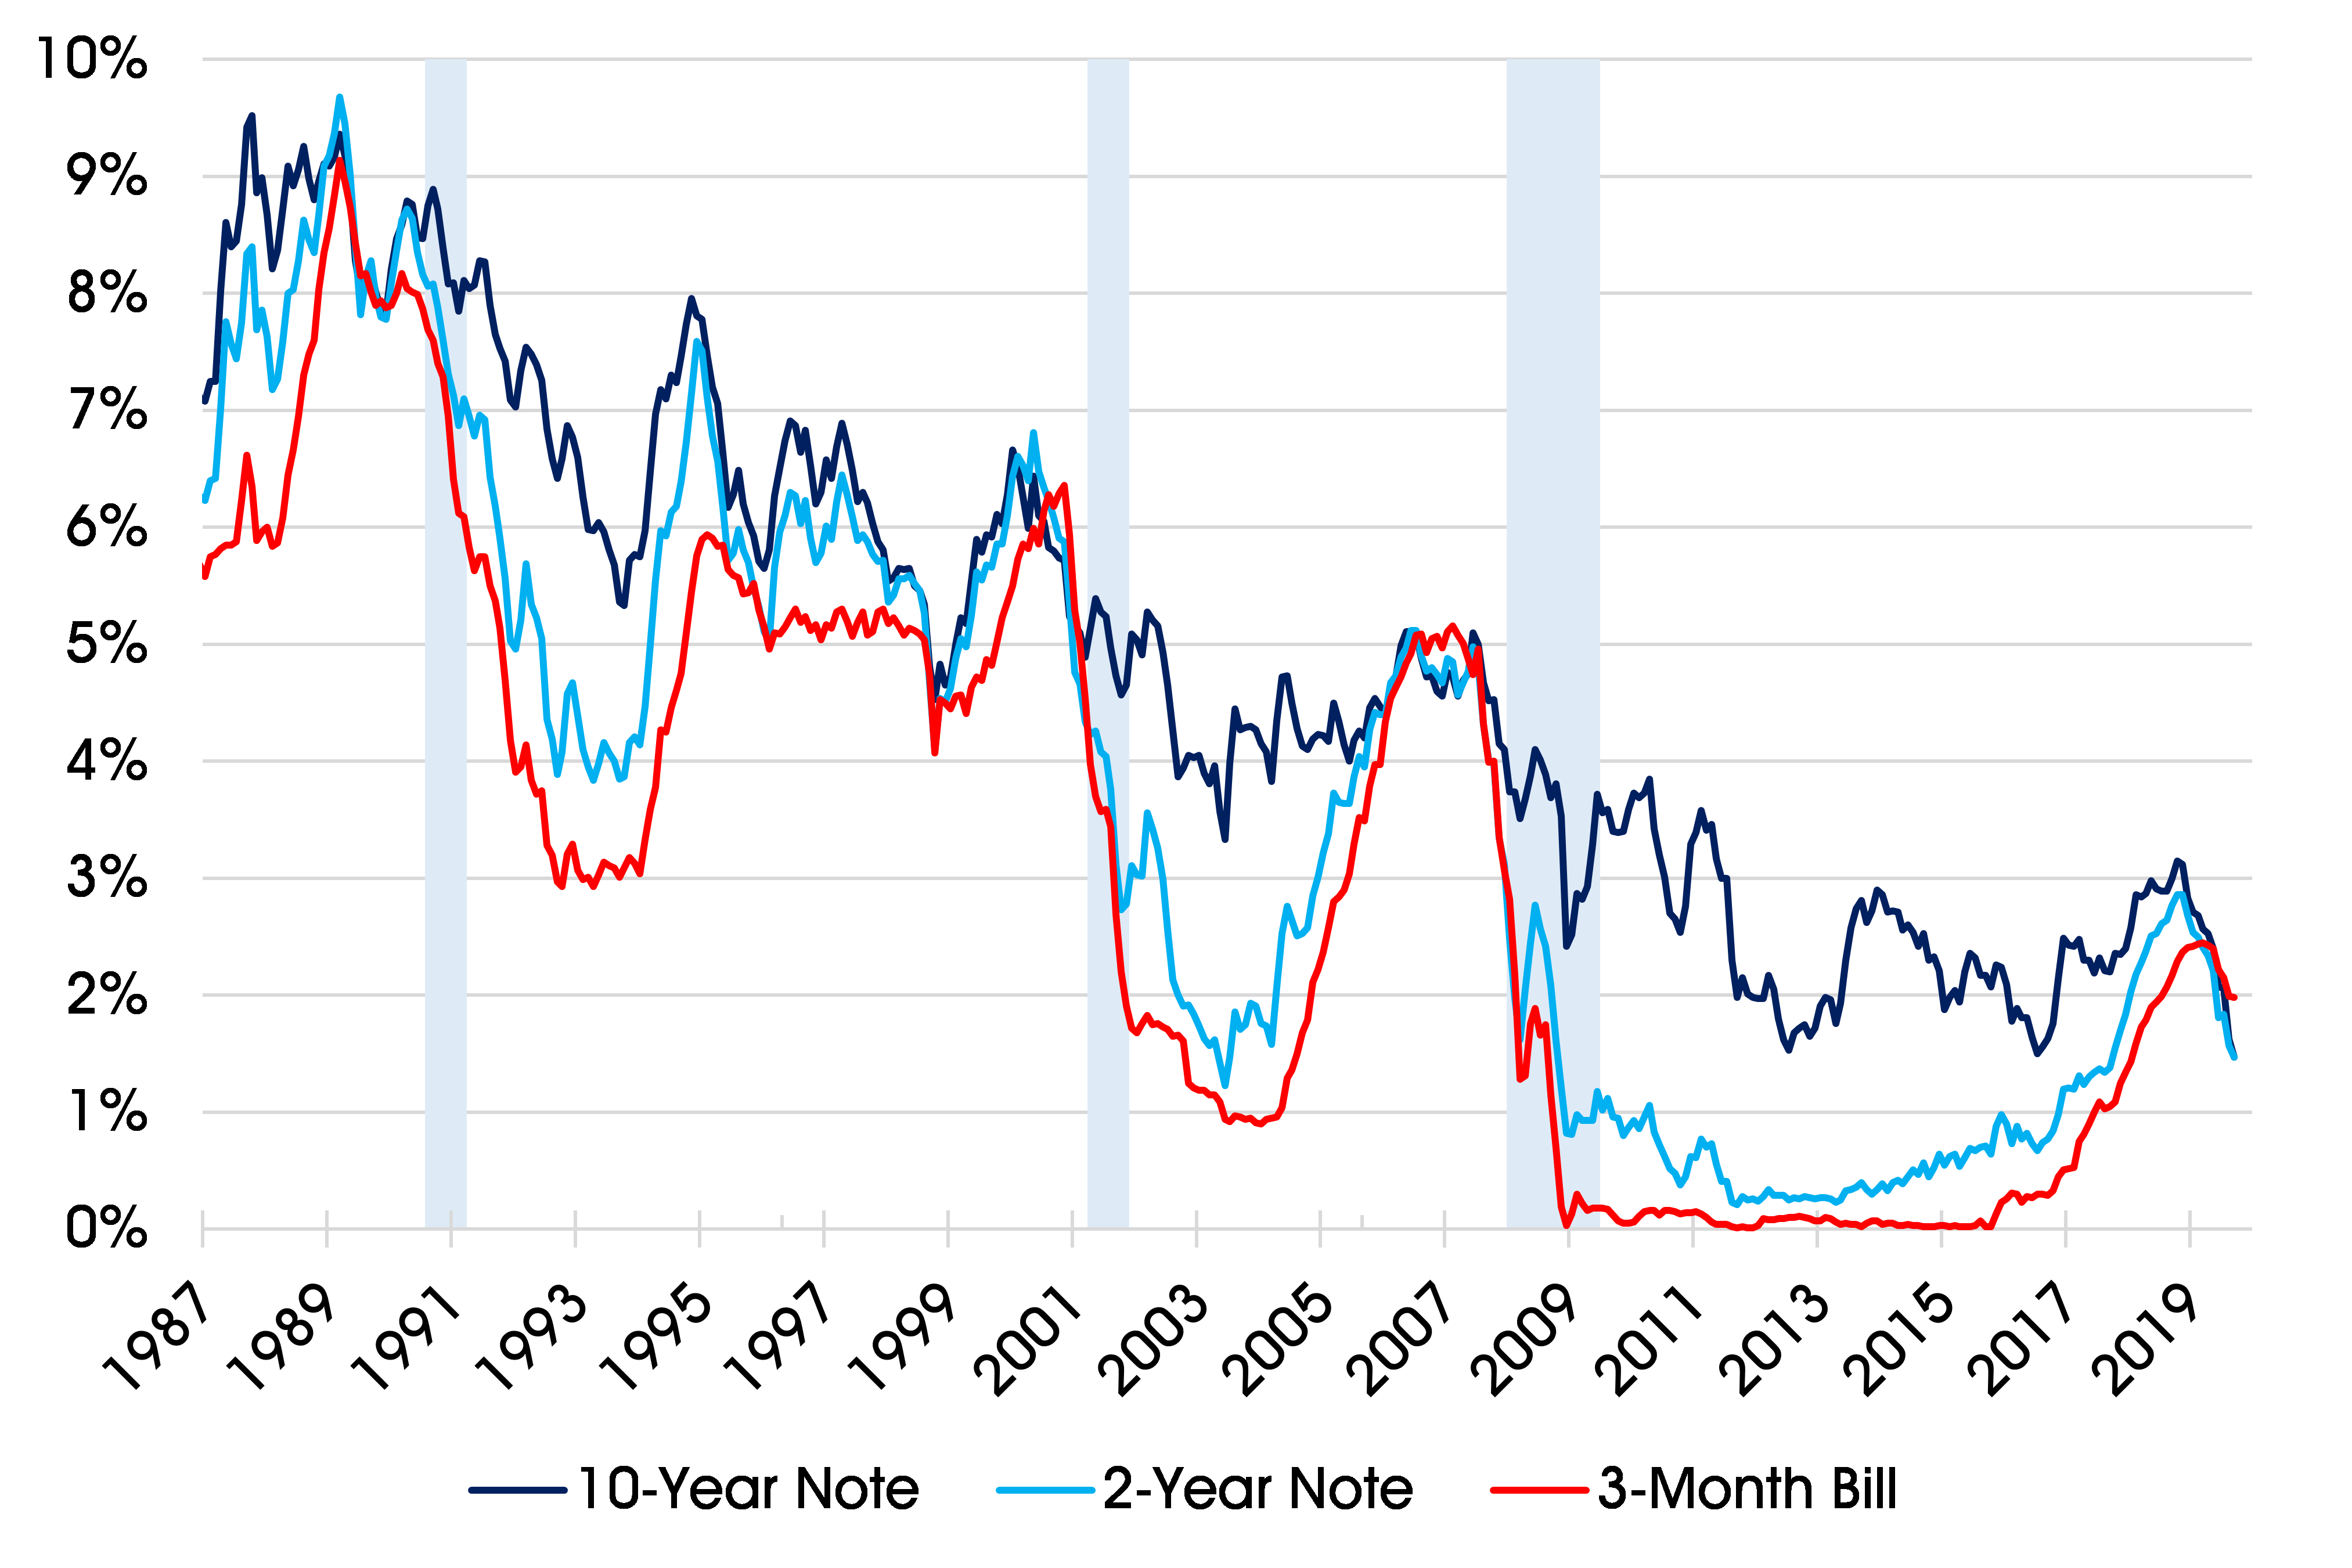
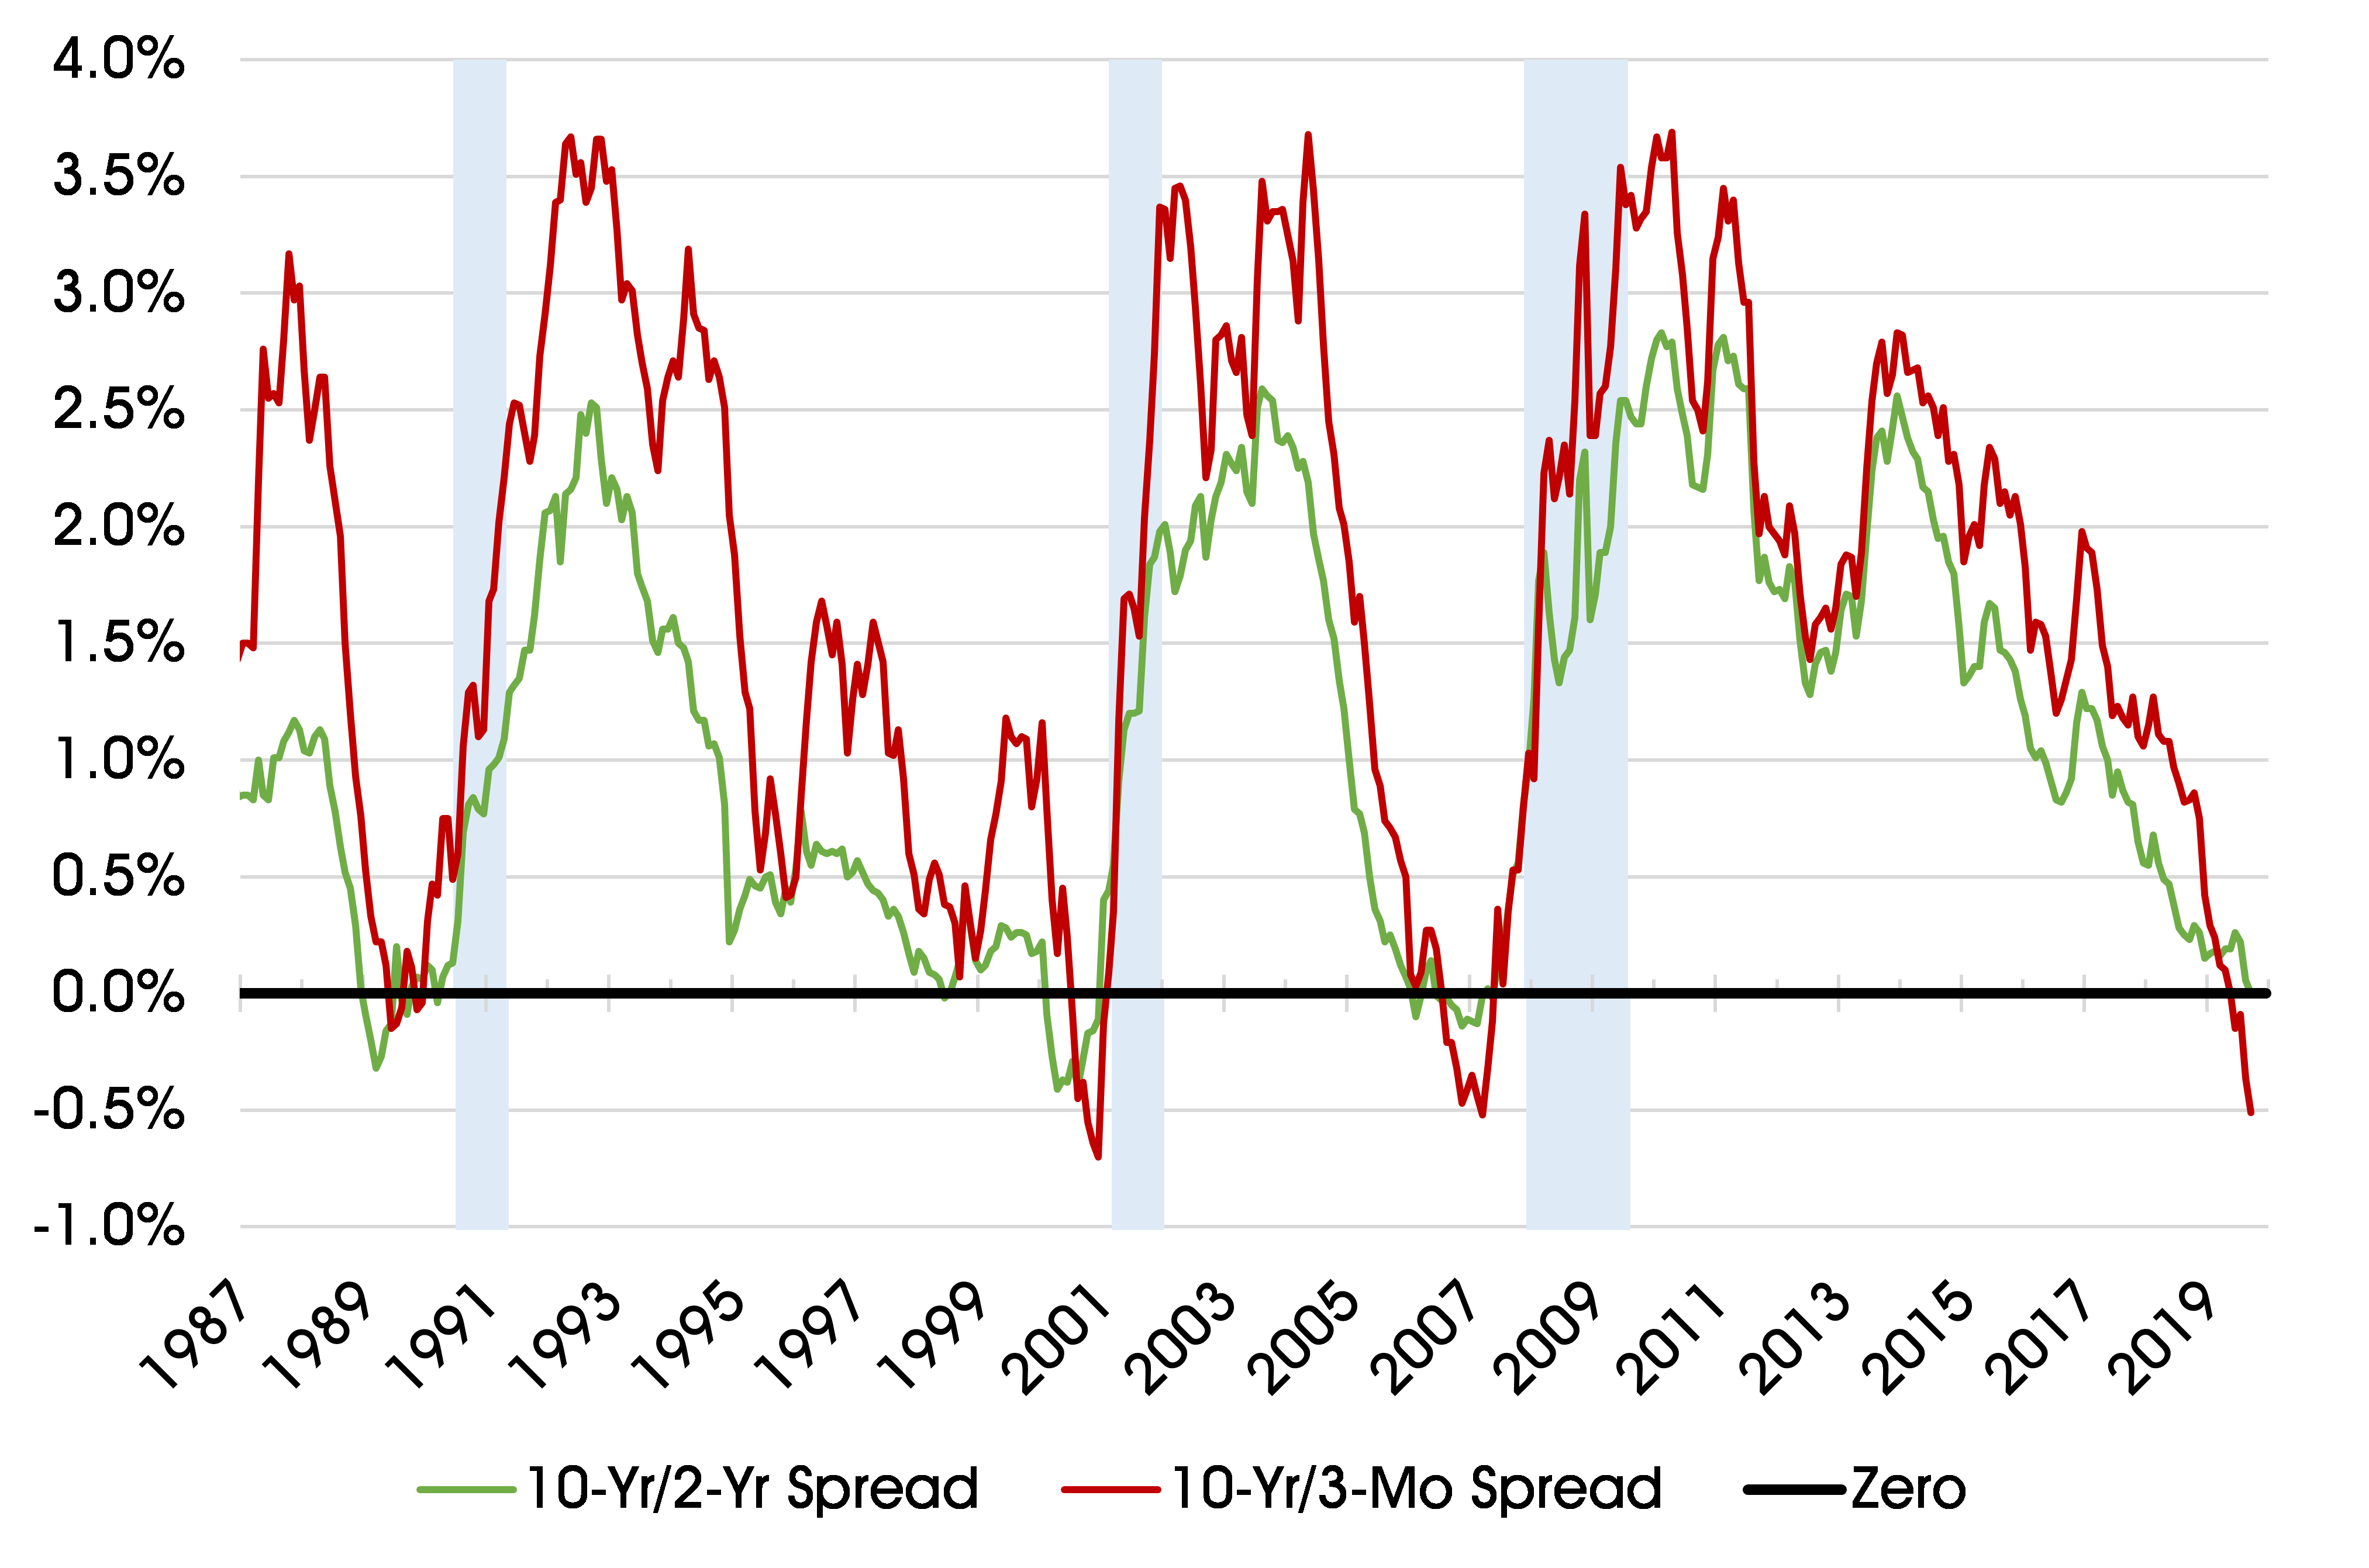
Note: Shaded areas denote recessions. Source: Board of Governors of the Federal Reserve System.
Risk of Recession Based on Yield Curve Growing; Negative Rates Abroad Contributing to Inversion
Typically, the Treasury yield curve inverts as a weakening of real business activity prompts traders and investors to anticipate a shift in monetary policy to a more accommodative stance. When the spread between 10-year notes and 3-month bills initially inverted at the end of May, neither Federal Reserve policymakers nor market participants were expecting near-term cuts in administered interest rates. The dot plot released following the Federal Open Market Committee’s (FOMC) March meeting indicated that unchanged policy was the most likely outcome for 2019, with a token 25-basis-point hike in the target range for the federal funds rate projected in 2020. Market participants almost universally expected no change in policy at the June gathering and a little more than three quarters thought the federal funds target range would remain at 2.25%-2.5% after the July FOMC meeting. Since that time, the constant-maturity, bond-equivalent spread between 10-year notes and 2-year notes has gone from about 15 bps to flat, while that between 10-year notes and 3-month bills has dropped from -15 bps to -51 bps.
While a near-term business cycle downturn appears remote, the inverted Treasury yield curve has raised fears of a recession further out (see chart below, top). The smoothed U.S. recession probabilities model maintained by Professor Jeremy Piger of the University of Oregon, which relies on nonfarm payrolls, industrial production, real personal income excluding transfer payments, and real manufacturing and trade sales – series considered by the National Bureau of Economic Research in determining business cycle turning points – placed the probability that the U.S. economy was in recession in July 2019 at just 1.5%. However, based on the increasingly negative bond-equivalent interest rate spread between the Treasury’s 10-year note and 3-month bill, the Federal Reserve Bank of New York’s model put the chances that the economy will be in a recession in August 2020 at 37.9%, well above the 31.7% average prevailing ahead of the last three cyclical downturns. Moreover, with that spread widening further, the odds of recession are poised to climb again in September. In the current environment, we need to be mindful of the impact that weaker economic activity abroad may be having on the Treasury yield curve. The U.S. currently sports the highest interest rates across the Group of Seven and Switzerland. Indeed, in four of the eight countries – France, Germany, Japan and Switzerland – yields at key maturities are all below zero (see chart below, bottom). The attractiveness of investing in a steadily appreciating currency, moreover, cannot be overlooked.
Exhibit 2: Recession Probabilities (chart top) and Selected International Interest Rates (chart bottom)
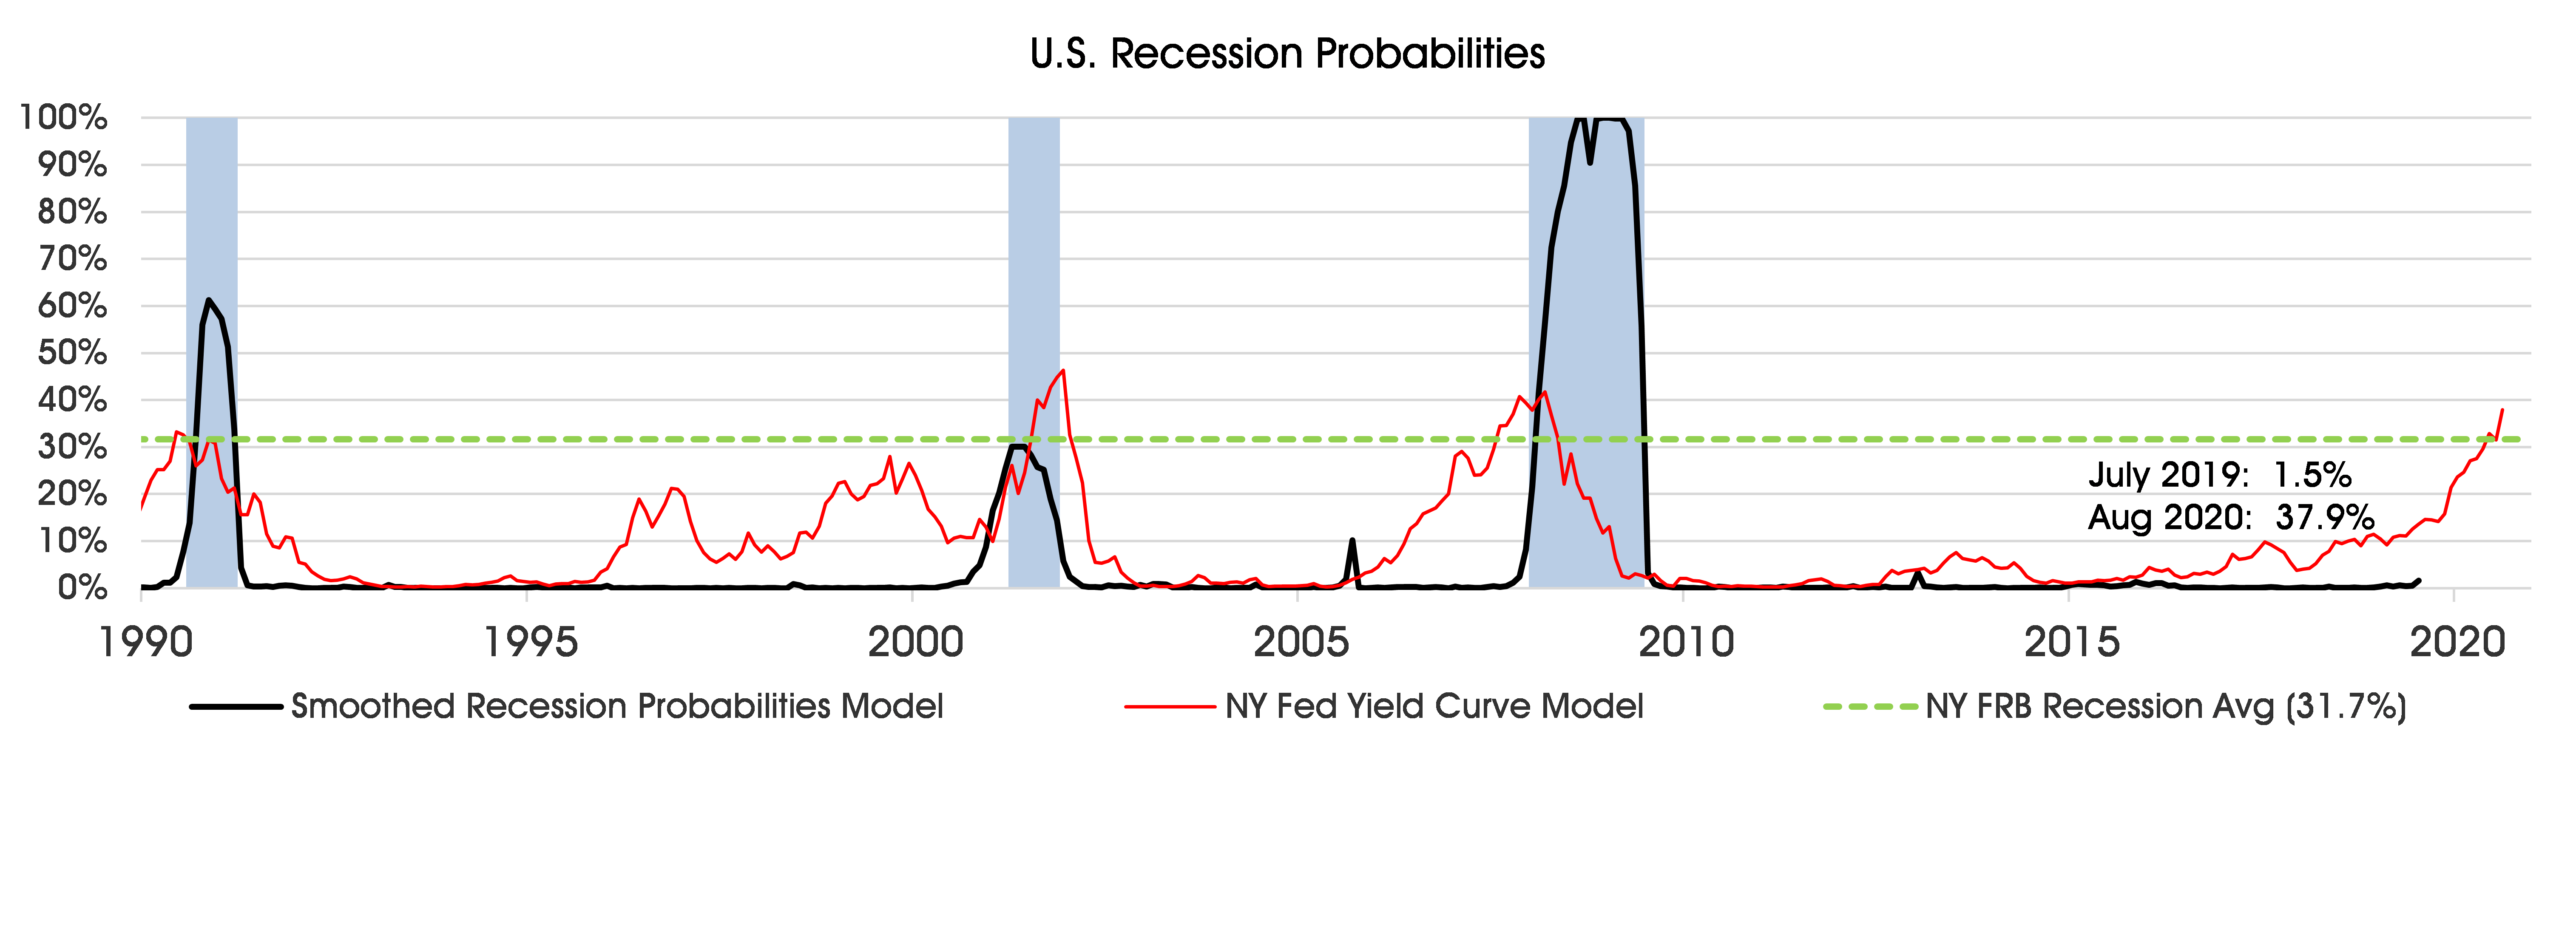
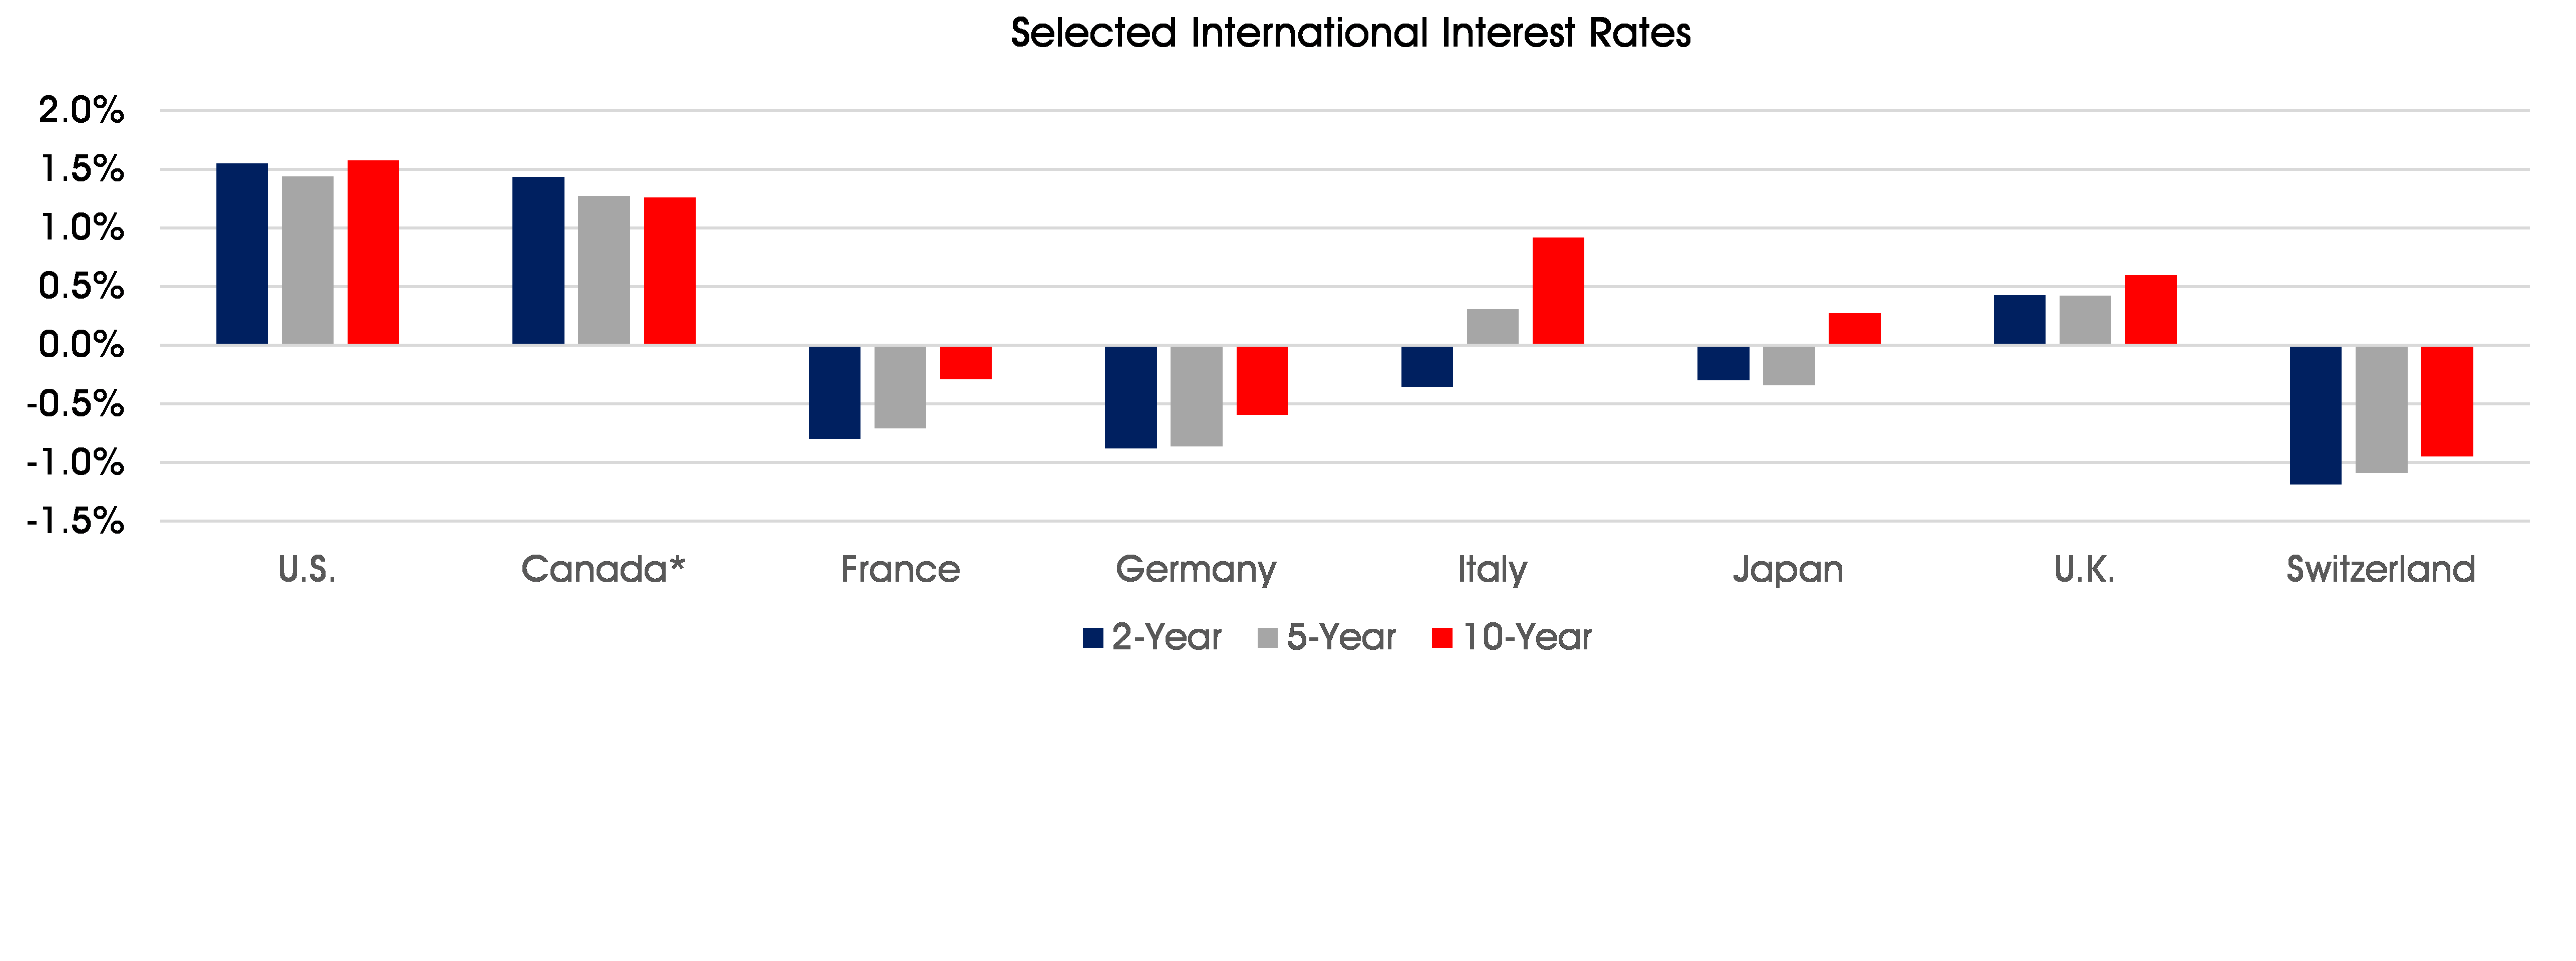
Notes: Blue shaded areas denote recessions. Asterisks denote 10-yr/2-yr yield curve inversions. Sources: Federal Reserve Banks of New York and St. Louis, Bloomberg
Yield Curve Inversions by Themselves Do Not Cause Business Cycle Downturns
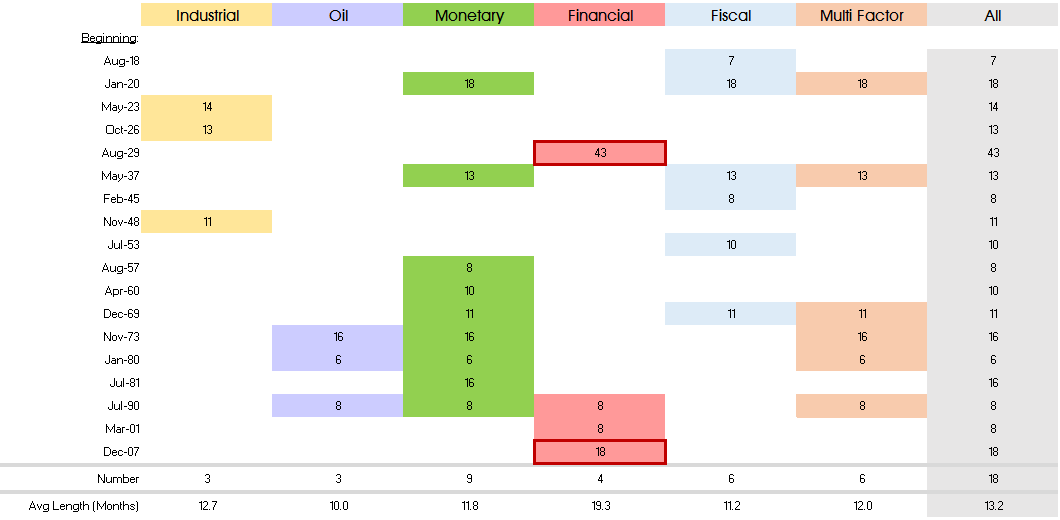
More often than not, inversions of the Treasury yield curve are reflections of imbalances in the domestic economy and do not by themselves cause business-cycle downturns. Five factors have been primary drivers of recessions in the U.S. over the past one hundred years: mismatches between demand and supply in the industrial sector, oil price shocks, overly restrictive monetary policy, financial crises and fiscal contractions in the wake of major military conflicts. Triggered by adverse financial-sector developments, the Great Depression and Great Recession were the longest cyclical downturns since the end of World War I, lasting 43 and 18 months, respectively. By comparison, those prompted by restrictive monetary policy have lasted 11.8 months, slightly longer than those caused by fiscal contractions. At this time, none of the factors listed above present serious challenges to the ongoing economic expansion. Indeed, domestic official institutions, international organizations and private-sector firms anticipate that the U.S. expansion will continue for at least two more years, with real GDP growing by 2.3% in 2019 followed by gains of 2.0% and 1.8%, respectively, in 2020 and 2021.
Exhibit 3: Primary Drivers of U.S. Business Cycle Downturns (duration in months)
To read more from Brian Jones, view the FHLBNY Economic Perspectives.
Disclaimer: Notwithstanding any language to the contrary, nothing contained in these disclosures is intended to constitute an offer, inducement, promise, or contract of any kind. Any product descriptions and pricing may be subject to change without notice.
The content provided in these disclosures is presented as a courtesy to be used only for informational purposes and is not represented to be error free. The FHLBNY makes no representations or warranties of any kind with respect to the content contained herein, such representations and warranties being expressly disclaimed. The FHLBNY is not a financial or investment advisor.
Moreover, the FHLBNY does not represent or warrant that the content of these disclosures is accurate, complete or current for any specific or particular purpose or application. It is not intended to provide nor should anyone consider that it provides legal, accounting, tax or other advice. Such advice should only be rendered in reference to the particular facts and circumstances appropriate to each situation. The FHLBNY encourages you to contact appropriate professional(s) and consultant(s) to assess your specific needs and circumstances and to render such advice accordingly. In addition, the FHLBNY is not endorsing or recommending the use of the means or methods contained in or through these disclosures for any special or particular purpose.
It is solely your responsibility to evaluate the risks or merits of any funding or investment strategy. In no event will FHLBNY or any of its officers, directors or employees be liable for any damages — whether direct, indirect, special, general, consequential, for alleged lost profits, or otherwise – that might result from any use of or reliance on these materials.